...

BTCUSD Technical Analysis – Surging to 32000

In today’s comprehensive BTCUSD technical analysis, we will meticulously examine the details of the BTC/USD pair’s technical analysis.

BTCUSD Technical Analysis – Surging to 32000

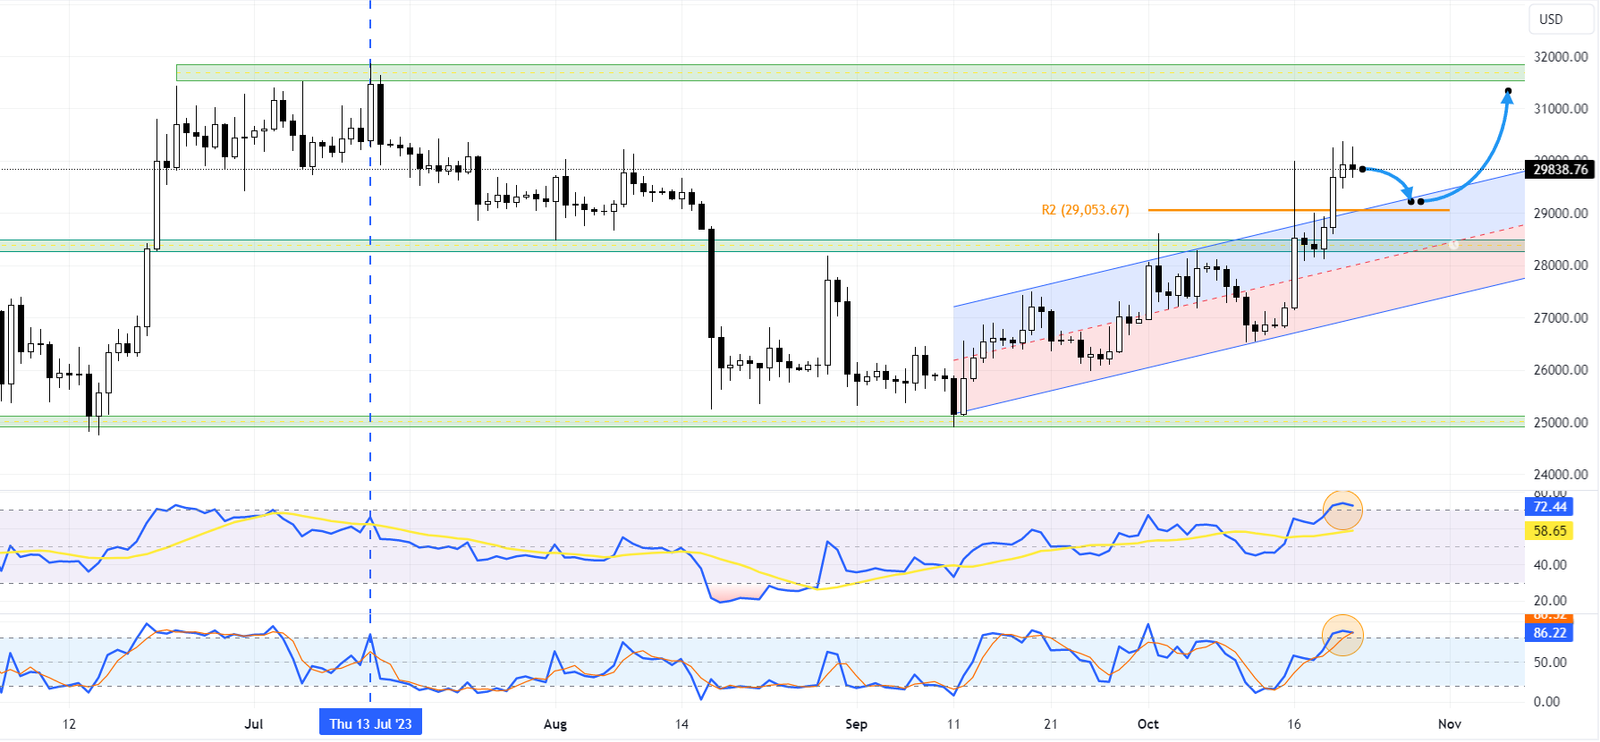
Bitcoin, the premier digital currency, is trading close to the significant psychological benchmark of $30,000. This comes after it surpassed the R2 resistance level, previously $29,053.

The Relative Strength Index (RSI), a crucial momentum indicator, is overbought. This is concurrently with the Stochastic oscillator, another key market momentum indicator. These indicators suggest that the market is heavily skewed toward the bulls. They aim for July’s high of $31,500, a level that has not been reached in a while.

However, it’s important to note that given the current momentum indicators, which indicate an overbought market, we could see a price correction near the $29,053 level. This particular level could provide an attractive opportunity for buyers to add new pressure to Bitcoin and further drive up its value. The main support zone for Bitcoin is currently established at $28,500. This is critical to monitor as any significant price drop below this support could invalidate the bullish scenario. In such a case, we might see a shift in market sentiment and a possible change in trend.
BTCUSD Technical Analysis - Surging to 32000
BTCUSD Technical Analysis – Surging to 32000

In conclusion, while Bitcoin’s current performance indicates a strong bullish trend with potential for further gains, investors should remain cautious due to the overbought market conditions and be prepared for possible price corrections.

Latest Posts

Gold Dipped Below $2667 Awaiting Direction

Gold traded sideways after it dipped below $2,667 and...

Gas Prices Dip Under $1.99 Amid Bearish Signs

Gasoline prices dropped below $1.99, which is active resistance....

Natural Gas Rebound Targets $3.24 and Beyond

U.S. natural gas bounced from $3.1, hinted by Stochastic's...

Crude Oil Head and Shoulders Signals Downward Trend

Crude oil formed a head and shoulders pattern in...

Inverted Hammer Hints at USDJPY Consolidation Ahead

USD/JPY trades bullish amid overbought signals. The 4-hour chart...

Gold Dipped Below $2667 Awaiting Direction

Gold traded sideways after it dipped below $2,667 and...

Gas Prices Dip Under $1.99 Amid Bearish Signs

Gasoline prices dropped below $1.99, which is active resistance....

Natural Gas Rebound Targets $3.24 and Beyond

U.S. natural gas bounced from $3.1, hinted by Stochastic's...

Crude Oil Head and Shoulders Signals Downward Trend

Crude oil formed a head and shoulders pattern in...

WTI Falls Below $71.5 on New Sanctions Against Russia

WTI Crude Oil prices fell slightly below $71.5 a...

Watch for Potential Drop in Gasoline Prices Below $2

FxNews—Gasoline is bullish. However, a dip below $1.99 could...

NATGAS Tests Critical Resistance: Bears Target $3.21

FxNews—The U.S. Natural Gas trades bullish above the %50.0...

Bullish Crude Oil Signals Overbought at $70.5

FxNews—Crude Oil trades bullish, above the 75-period simple moving...