In today’s comprehensive GBPJPY technical analysis, we will scrutinize Japan’s current economic conditions and then meticulously delve into the technical analysis of the GBPJPY pair.
Nikkei 225 and Topix Indices Rally
Bloomberg – On Tuesday, the Nikkei 225 Index experienced a modest rise, climbing 0.53% to settle at 30,859. Similarly, the Topix Index increased significantly, jumping 1.01% to reach 2,254. This uptick marked a recovery from the previous day’s downturn.
The rebound in the indices can be attributed to the Bank of Japan’s latest policy decisions. The bank maintained its supportive monetary policy but widened the fluctuation range for the 10-year Japanese government bond (JGB) yields to +/- 1% from the previous 0.5%. Additionally, it removed the promise of daily fixed-rate JGB buy operations and adjusted its inflation forecast higher.
BoJ Devalues Yen
Despite these seemingly stringent measures, investors appeared unfazed, having anticipated more aggressive policy shifts from the Bank of Japan, including a potential phase-out of yield curve control measures. Some of the index’s major players led the market’s advance, with Mitsubishi UFJ up by 2.2%, Sumitomo Mitsui up by 1.4%, Oriental Land up by 2.8%, Keyence up by 1.5%, and Japan Post Bank up by an impressive 3.6%.
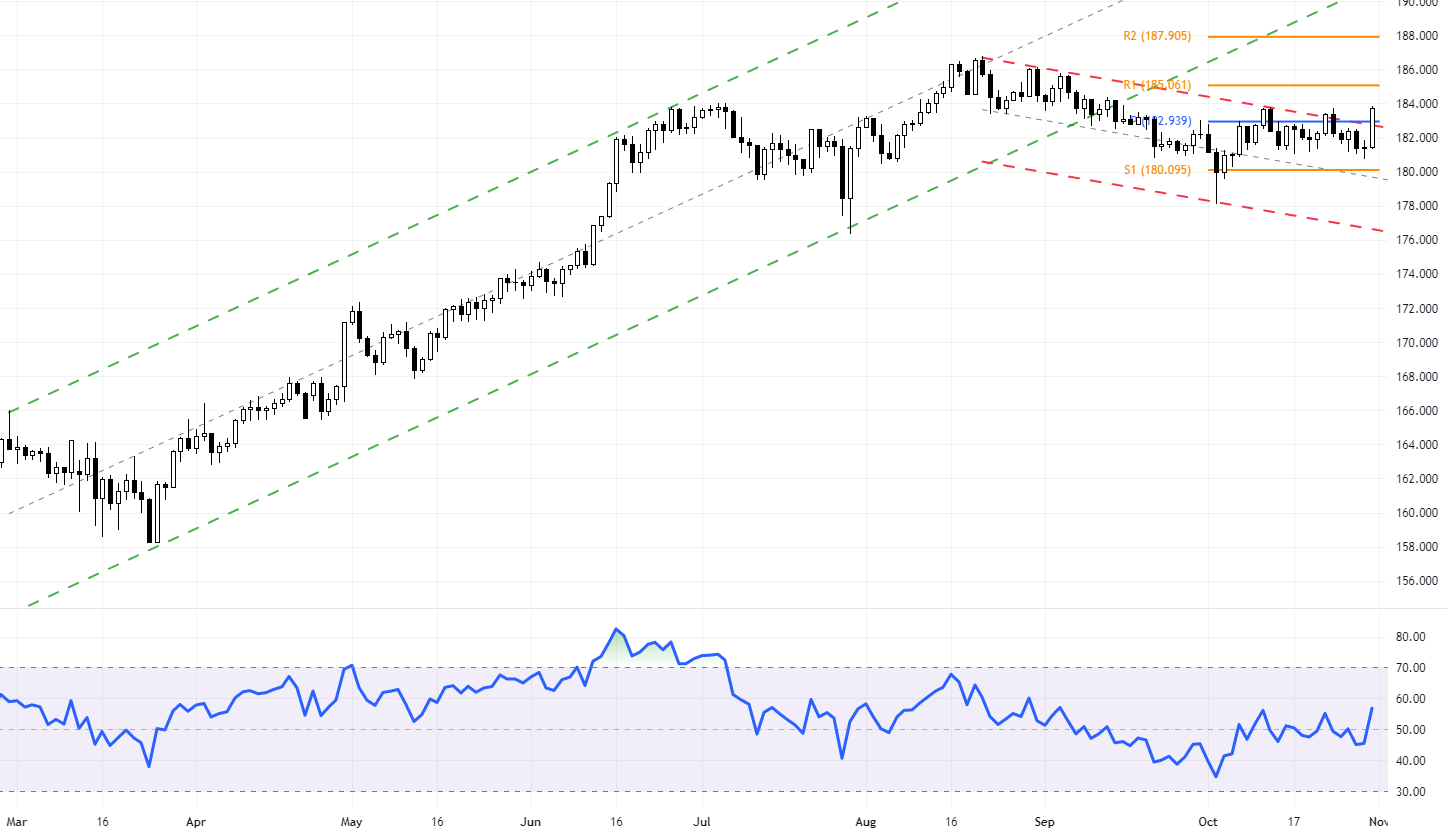
Embarking on a comprehensive GBPJPY technical analysis, we observe a significant shift in market dynamics. The GBPJPY currency pair has emerged from a downtrend, as evidenced by its break from the bearish channel on the daily chart. Currently, the pair trades confidently above the 182.9 pivot point, which suggests renewed vigor among buyers.
GBPJPY Forecast: A Bullish Momentum on the Ris
The daily chart offers a clear picture of the changing tides, with the Relative Strength Index (RSI) maintaining a position above the 50 mark. This is a classic indicator of bullish momentum, implying that the currency pair’s buyers are gaining strength and could be steering the market into a more positive phase.

The 4-Hour Chart Perspective
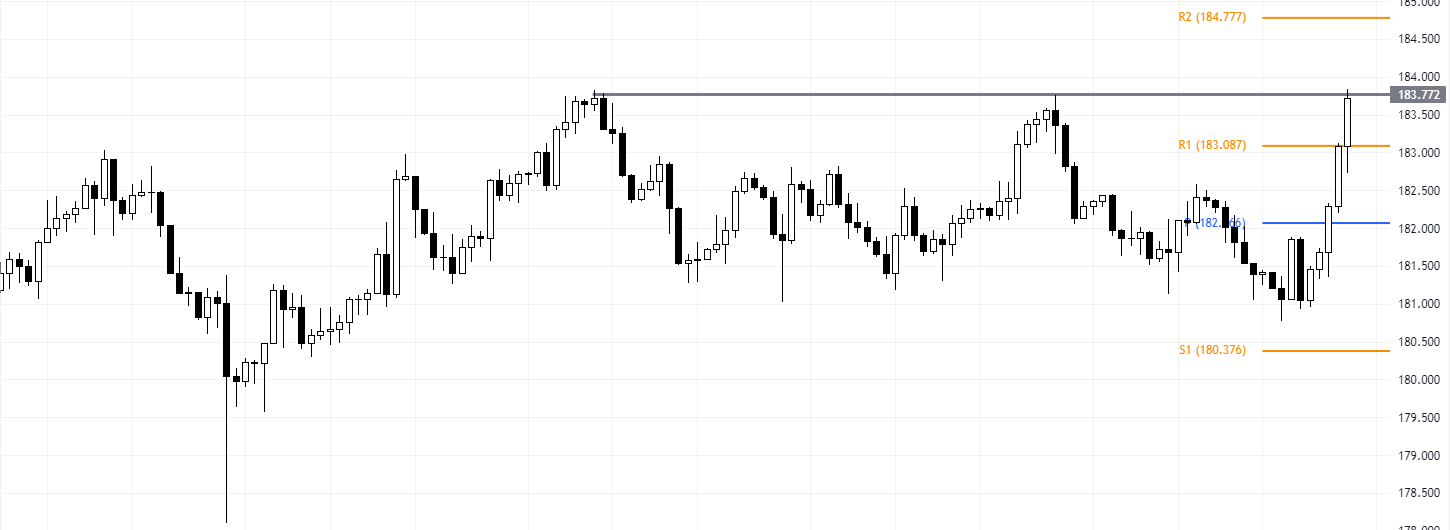
When we narrow our focus to the 4-hour chart, a critical resistance level at 183.7 comes into play. This level is the next significant hurdle for the bulls. Overcoming this barrier is crucial for the GBPJPY pair to extend its gains. A successful breach of this resistance could clear the path toward the next target, the R2 level, marking a potential upward trend continuation.

The ability of GBPJPY to surpass the 183.7 resistance is pivotal. A breakthrough would likely confirm the bullish momentum suggested by the daily chart, potentially leading to a sustained upward movement. This would be an encouraging sign for bullish traders on the GBPJPY pair, as it could indicate the start of a new bullish phase.
- Also read: GBPJPY Forecast and BoJ’s Policy Adjustments
The Bearish Scenario
Conversely, should the GBPJPY pair fail to break through the 183.7 resistance, we may see a reversion to the bearish channel. Such a move would suggest that the bullish surge was temporary and that the pair is not yet ready to establish a consistent upward trajectory.