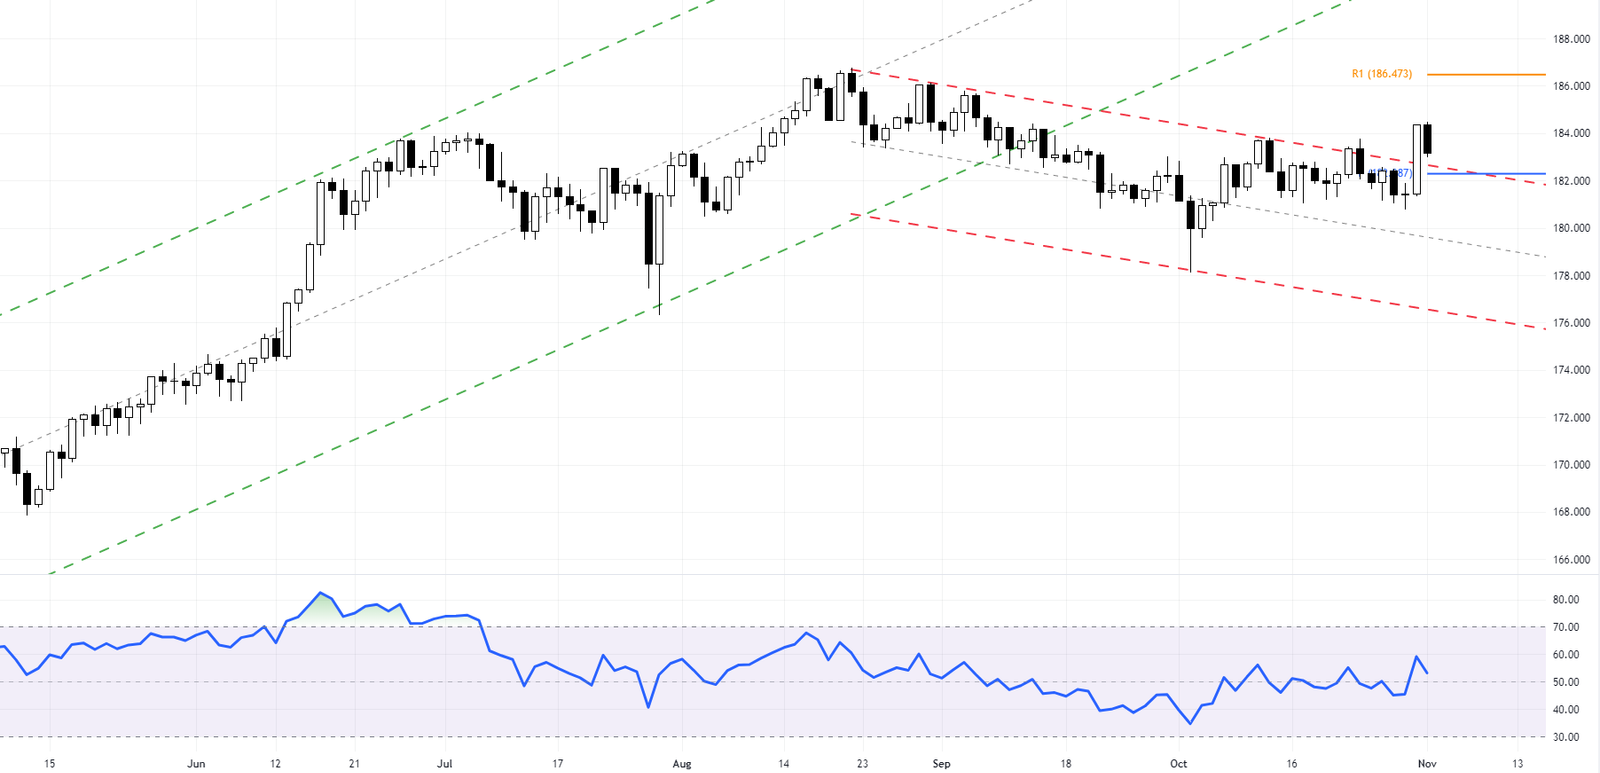
In today’s comprehensive GBPJPY forecast, we will first examine the current economic conditions in Japan. Then, we will meticulously delve into the details of the technical analysis of the GBPJPY pair.
GBPJPY Forecast and BoJ’s Policy Adjustments
Bloomberg–The Japanese yen has seen a depreciation, moving beyond 151 per dollar. This places it near its lowest point in a year and could weaken further, reaching lows not seen since 1990. This is largely due to the Bank of Japan’s (BOJ) decision to relax its control over long-term rates, which many believe falls short of addressing the interest rate disparities that have been putting pressure on the currency for years.
The BOJ has held its policy rate steady at -0.1% and kept the 10-year JGB yield target at approximately 0% while making minor tweaks to its yield curve control policy. The central bank has redefined 1% as a flexible “upper bound” rather than a strict limit. It has withdrawn its commitment to uphold this level by offering to purchase an unlimited quantity of bonds.
Looking ahead, the BOJ has upgraded its inflation forecast for fiscal years 2023, 2024, and 2025. It predicts that core CPI inflation will gradually approach the 2% price stability target. However, they underscored that a positive feedback loop of increasing prices and wages should drive this rise.
GBPJPY Forecast: Testing Key Levels
The GBPJPY pair is experiencing a pullback from yesterday’s high. We are testing the previously broken bearish channel and the monthly pivot on the daily chart.

When we zoom into the 4H chart, the bears have pushed the price below the broken resistance at 183.77. At present, the price is testing the 0.382 level. With the RSI indicator nearing the 50 mark, the decline might extend to the 50% Fibonacci retracement level.

The market sentiment for GBPJPY remains bullish in the long term. However, if the price drops below the 50% Fibonacci retracement level, it would invalidate the bullish scenario. In such a case, the recent bullish breakout observed in the GBPJPY daily chart would be considered a false breakout, and we could expect the price to continue trading within the daily bearish channel.
This revised text includes keywords and phrases that could improve its search engine visibility.

J.J Edwards is a finance expert with 15+ years in forex, hedge funds, trading systems, and market analysis.


