In today’s comprehensive AUDUSD technical analysis, we will scrutinize the currency pair’s price action and then meticulously delve into its fundamental analysis.
AUDUSD Technical Analysis
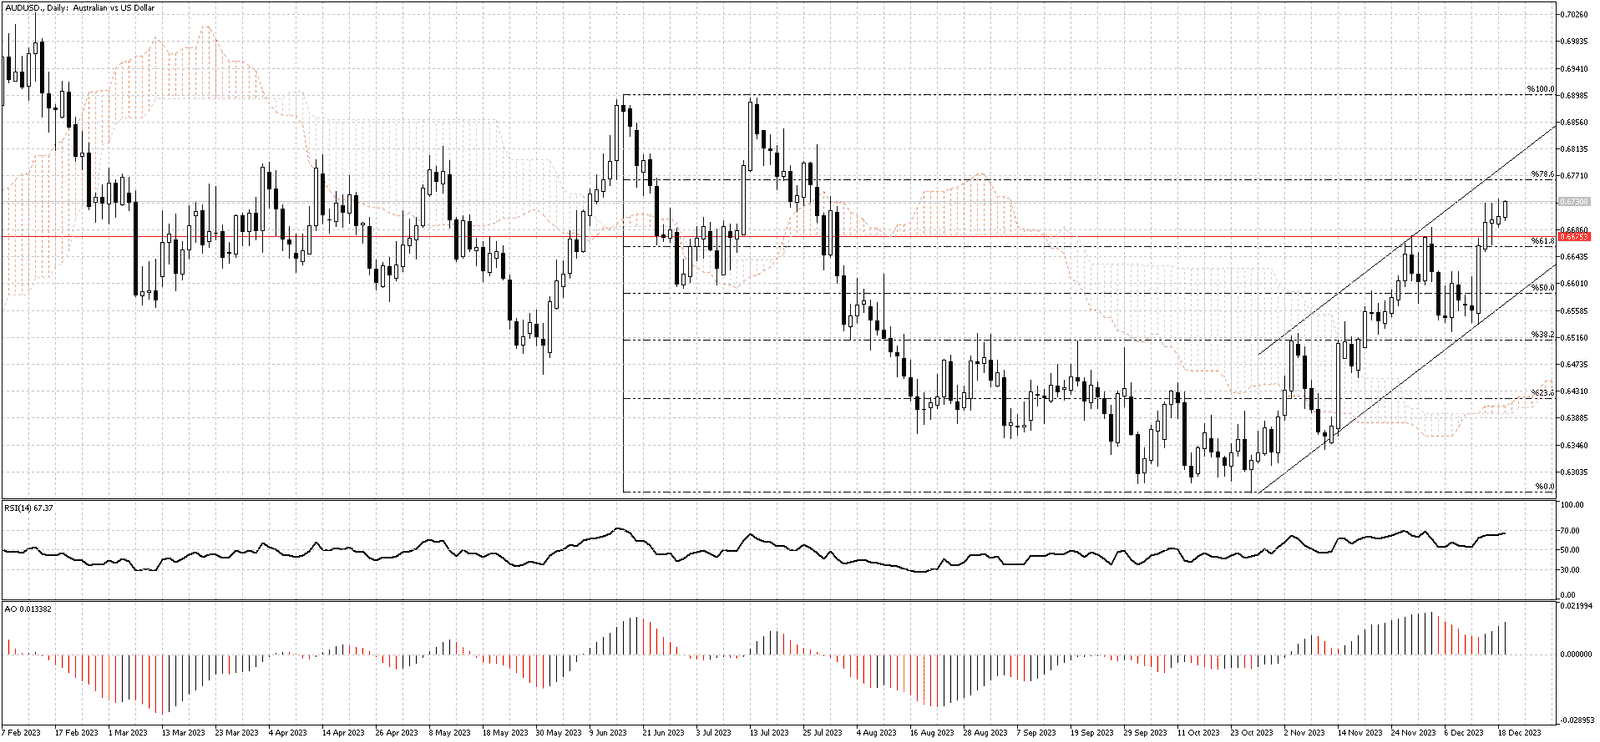
FxNews – The AUDUSD currency pair’s uptrend has persisted since it surpassed the early December high of 0.6675. Several technical indicators suggest that this bullish trend is likely to continue. The RSI (Relative Strength Index) is nearing the overbought zone, indicating strong buying momentum.
Additionally, the Awesome Indicator shows green bars, which typically signal upward movement in the market. These factors, combined with the formation of a bullish flag pattern, suggest that the AUDUSD price may target the upper line of this bullish flag.
The level of 0.6675, along with the 61.8% Fibonacci retracement level, supports this bullish technical analysis. As long as the market remains above these support zones, the bullish outlook for AUDUSD remains credible.

However, if the bears push the price below the 61.8% Fibonacci level and stabilize it there, this would challenge the bullish perspective. In such a case, the next level of support to watch would be the 50% Fibonacci level. This level gains additional significance as it aligns with the lower line of the flag pattern, reinforcing it as a potential support area.
Australia S&P/ASX 200 Index Recovers
Bloomberg—On Tuesday, the S&P/ASX 200 Index climbed by 0.8%, settling at 7,489 and reversing its previous session’s losses. This rise was primarily driven by the energy sector, which benefited from more substantial oil prices.
Australian stocks mirrored the overnight advancements on Wall Street, as investors seemed to overlook the Federal Reserve officials’ comments against the anticipation of interest rate cuts. Locally, the focus is now on the upcoming Reserve Bank of Australia meeting minutes, which are expected to provide insights into the future of interest rates.
Leading the gains in the energy sector were companies like Woodside Energy, which rose by 1.7%; Carnarvon Energy, up by 5.1%; Karoon Energy, increasing by 4.4%; and Beach Energy, which grew by 3.2%. Other significant contributors to the index’s rise were QBE Insurance, gaining 3.9%, and Fortescue Metals, which increased by 1.1%.