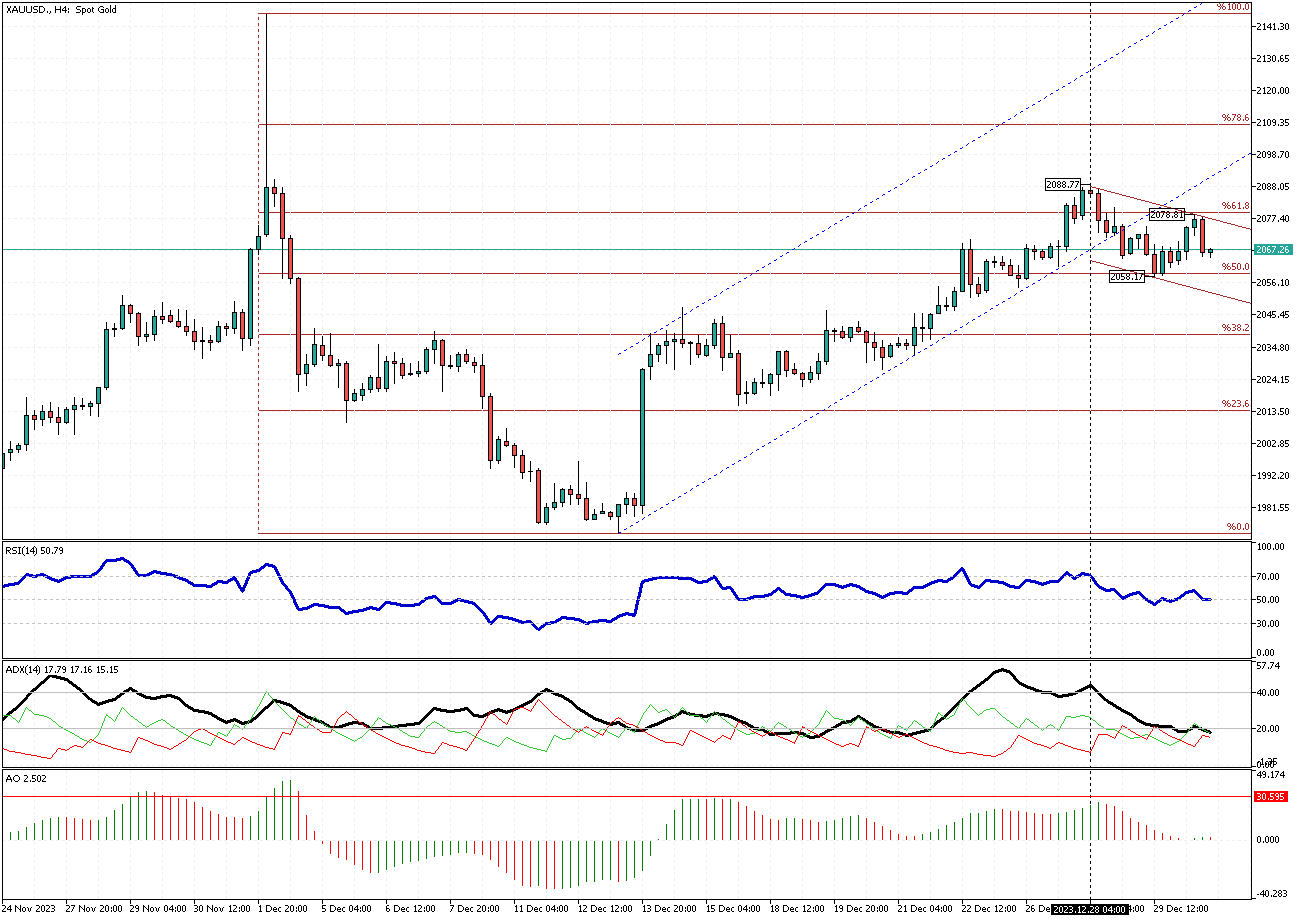
In today’s comprehensive gold technical analysis, we will examine the currency pair’s price action in the 4-hour chart. Then, we will explore the technical indicators and key Fibonacci levels to see what could be next for the XAUUSD.
Gold Technical Analysis – January-2-2024
FxNews – The yellow metal’s upward trend slowed when the price reached the $2,088 high on December 28, 2023. This resistance level is also in conjunction with the highest closed price on the December 4, 2023, 4-hour chart. After this surge, the XAUUSD has been trading sideways, with the current price around $2,066.
The sideways trend ranges between the 50% Fibonacci support level ($2,058 mark) and the 61.8% Fibonacci resistance level, the $2,088 mark.

Technical Indicators Signal Uncertainty
In the XAUUSD 4-hour chart, we notice the pair crossed below the bullish channel, which could signify a longer halt in continuing the uptrend.
Technical indicators give a range of market signals. The RSI indicator hovers around the middle line, and the Awesome oscillator bars are small and cling to the signal line. Both indicators show uncertainty. Interestingly, the ADX indicator’s signal clears the air. The ADX line is near the 20 level, a transparent sign of no trend in the gold market.
The Bearish Scenario
The pullback from 2,088 dollars can be considered the start of a consolidation phase. The 50% Fibonacci level supports the main bullish trend, which began in mid-December 2023. If the gold price crosses below the 50% level, the decline will extend to the lower band of the bearish channel, followed by the 38.2% Fibonacci support.
The Bullish Scenario
If the $2,088 resistance plays the main hurdle for the bulls. They need to break the level to pave the way to $2,109.