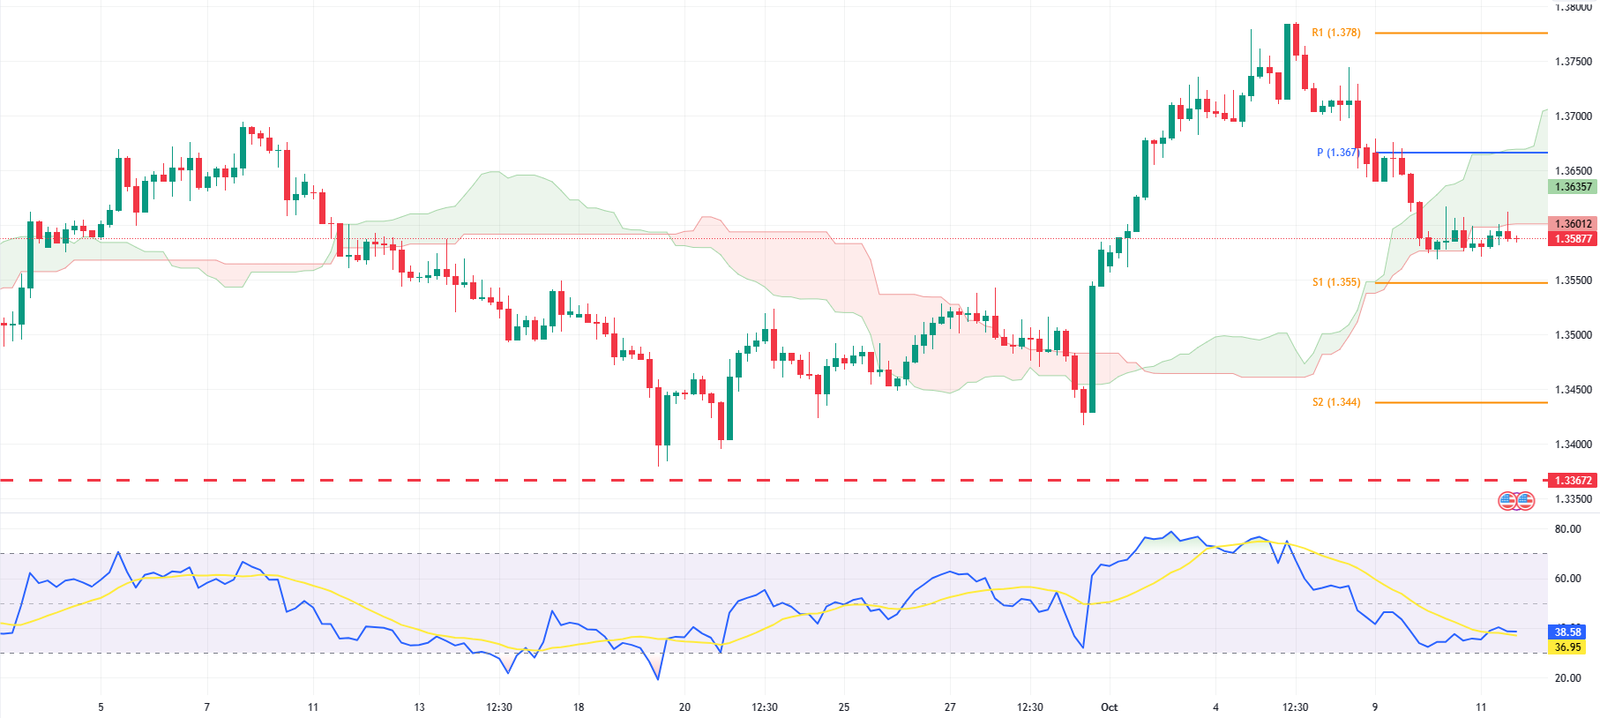
The USD/CAD currency pair has closed below the Ichimoku cloud in the 4H chart. However, a closer look at the candlestick shapes reveals uncertainty in the bearish bias. The candles’ bodies are small, and we observe inverted hammer and long wick candlestick patterns that signal a potential shift in trend or correction.
USDCAD Finds Strength at 1.355 as RSI Signals Bullish Momentum
The close below the Ichimoku cloud may initially seem alarming, but it is a false alarm. The 1.355 support level is strong, suggesting that the bearish trend may not be as strong as initially perceived. However, the RSI indicator crossed the RSI-based moving average in the USDCAD 4H chart, signaling bullish market strength. This is a positive sign for those looking for an upward trend.

Market Interest and Strength
Current technical indicators suggest that the market lacks interest or strength. However, if the bulls maintain their hold on the 1.355 level, they will likely drive the currency pair to its previous high of 1.378.

The USDCAD Bearish Scenario
On the flip side, if the bears close USDCAD below the support level, the Ichimoku signal will gain more validity than it currently holds. In this scenario, we can expect a decline to lower levels starting with the 1.344 mark.
Next read: In-Depth Ichimoku NZDUSD Market Analysis
In conclusion, while there are signs of a bearish trend in the USD/CAD market, several indicators suggest this may be a false alarm. To navigate this uncertain markBullsor key support and resistance levels.