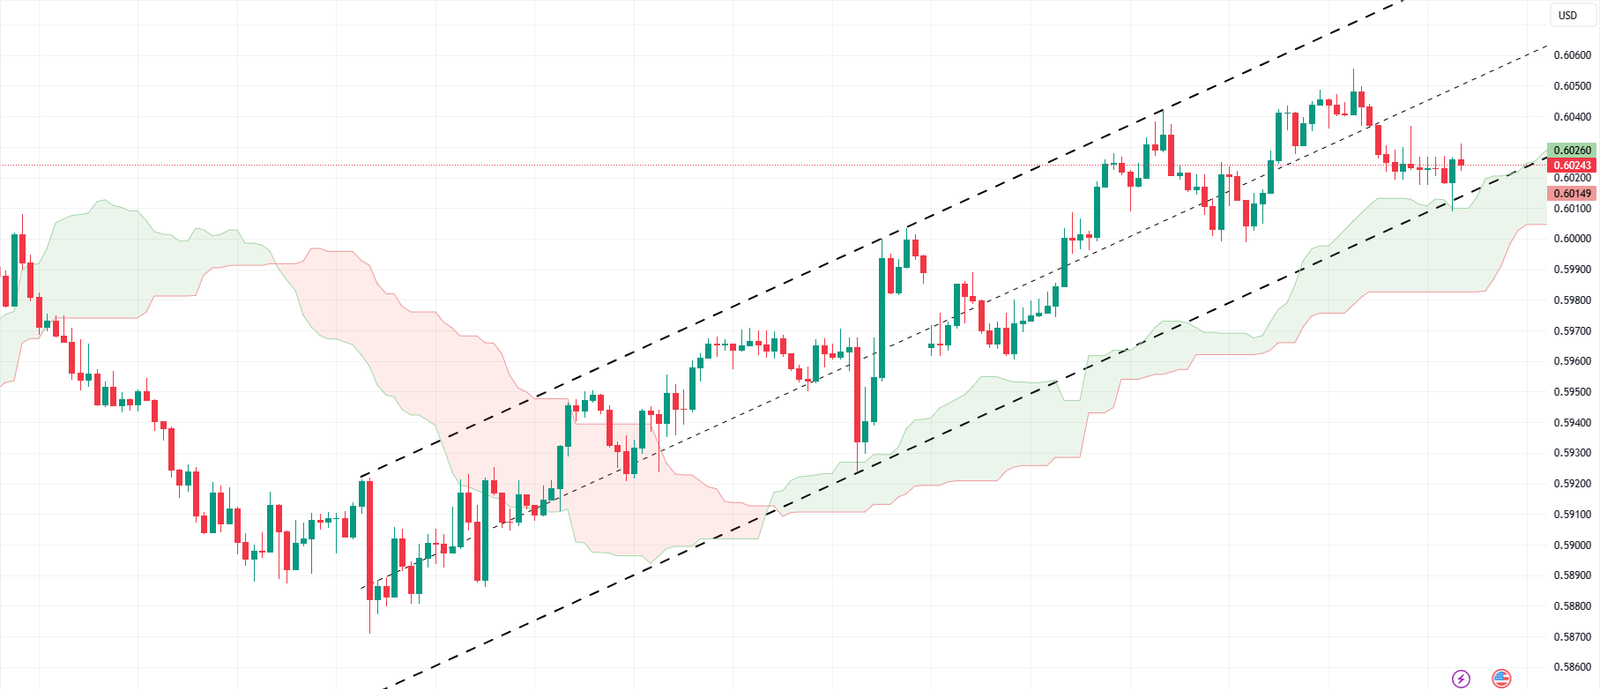
FxNews—The NZD/USD currency pair is currently undergoing a crucial testing phase with the signal lines of the technical indicator. This is a significant development as it could indicate a shift in the market dynamics. The NZD/USD pair is trending upwards, as evidenced by its position above the Ichimoku Cloud.
Market Eyes Key Level at 0.5995 for Further Uptrend
This strongly indicates an uptrend, suggesting that bullish market conditions are prevailing. Traders and investors often view this as a positive sign, indicating potential opportunities for long positions.
In terms of future movements, we anticipate testing the upper boundary of the Cloud at 0.5995. Should this level be reached and successfully tested, it could pave the way for a further rise to 0.6085. This would represent a significant upward move, further confirming the bullish trend.

A rebound from the lower boundary of the bullish channel could confirm this upward trajectory. This would serve as another strong indication of the prevailing uptrend, reinforcing the potential for further price increases.
NZDUSD Technical Analysis: Bearish Scenario
However, it’s important to note that a breakout of the lower boundary of the Cloud could invalidate this scenario. If the price secures under 0.5965, this suggests a shift towards bearish market conditions and could lead to a further decline to 0.5875.
Next read: GBP/JPY Market Analysis – Buying Pressure is Started
In conclusion, while current indications suggest an uptrend for the NZDUSD pair, traders should remain vigilant for potential shifts in market conditions. As always, it’s crucial to use a combination of technical indicators and sound risk management strategies when trading in the forex market.