FxNews—In this detailed GBPJPY market analysis, we examine the pair’s behavior on the Daily chart.

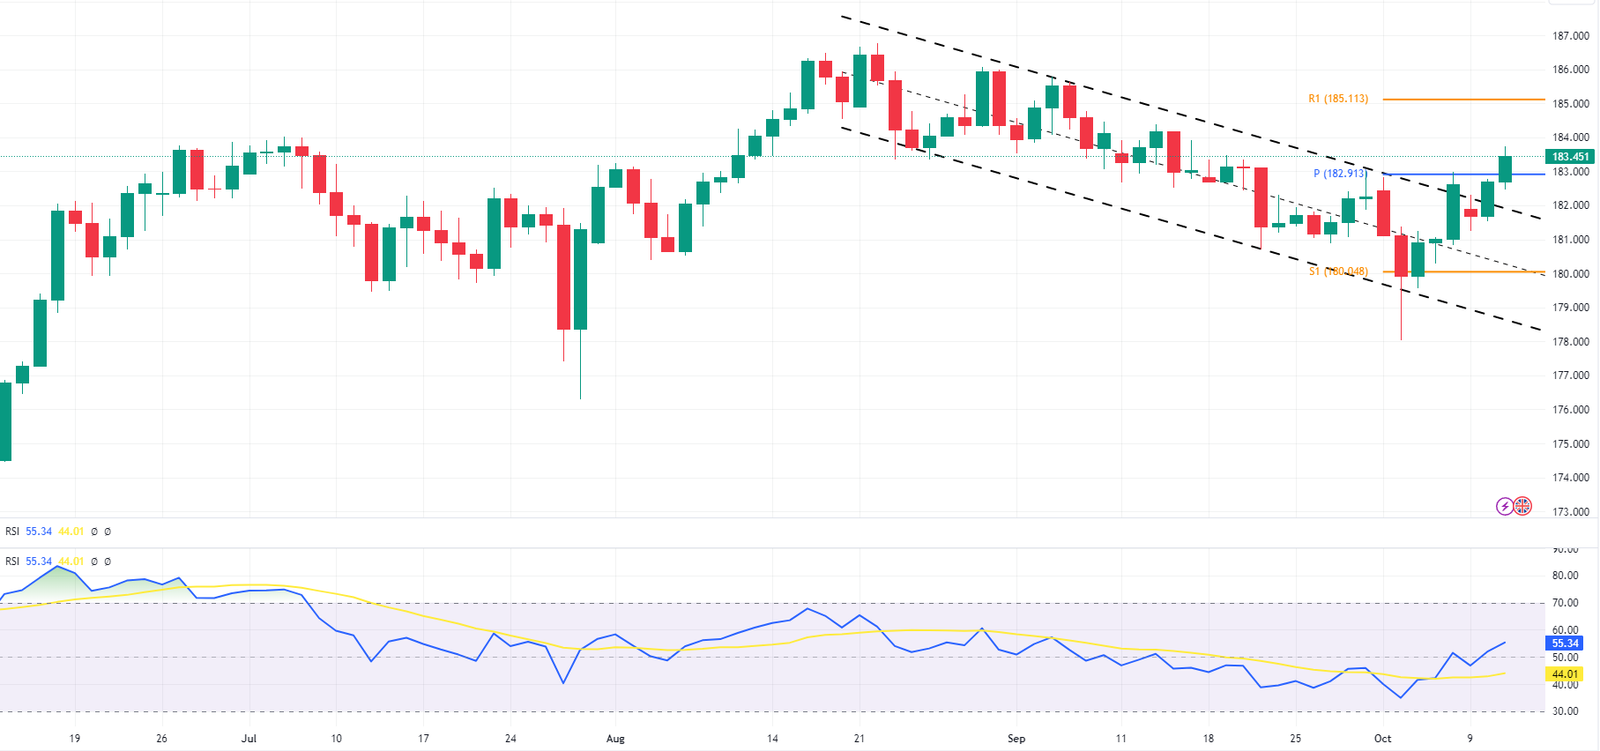
The GBPJPY pair recently broke out of its trading channel, testing the 182.9 pivot. Following a rebound, the bulls broke the pivot in today’s trading session. The RSI indicator has flipped above the crucial 50 level, suggesting that the uptrend will likely continue.

While oscillators remain in the sell zone, moving averages signal a strong buy. A summary of more than 20 indicators points towards a bullish market direction, reinforcing the positive outlook for GBP/JPY.
GBPJPY Bulls Watch for Key Support Test at 182.9
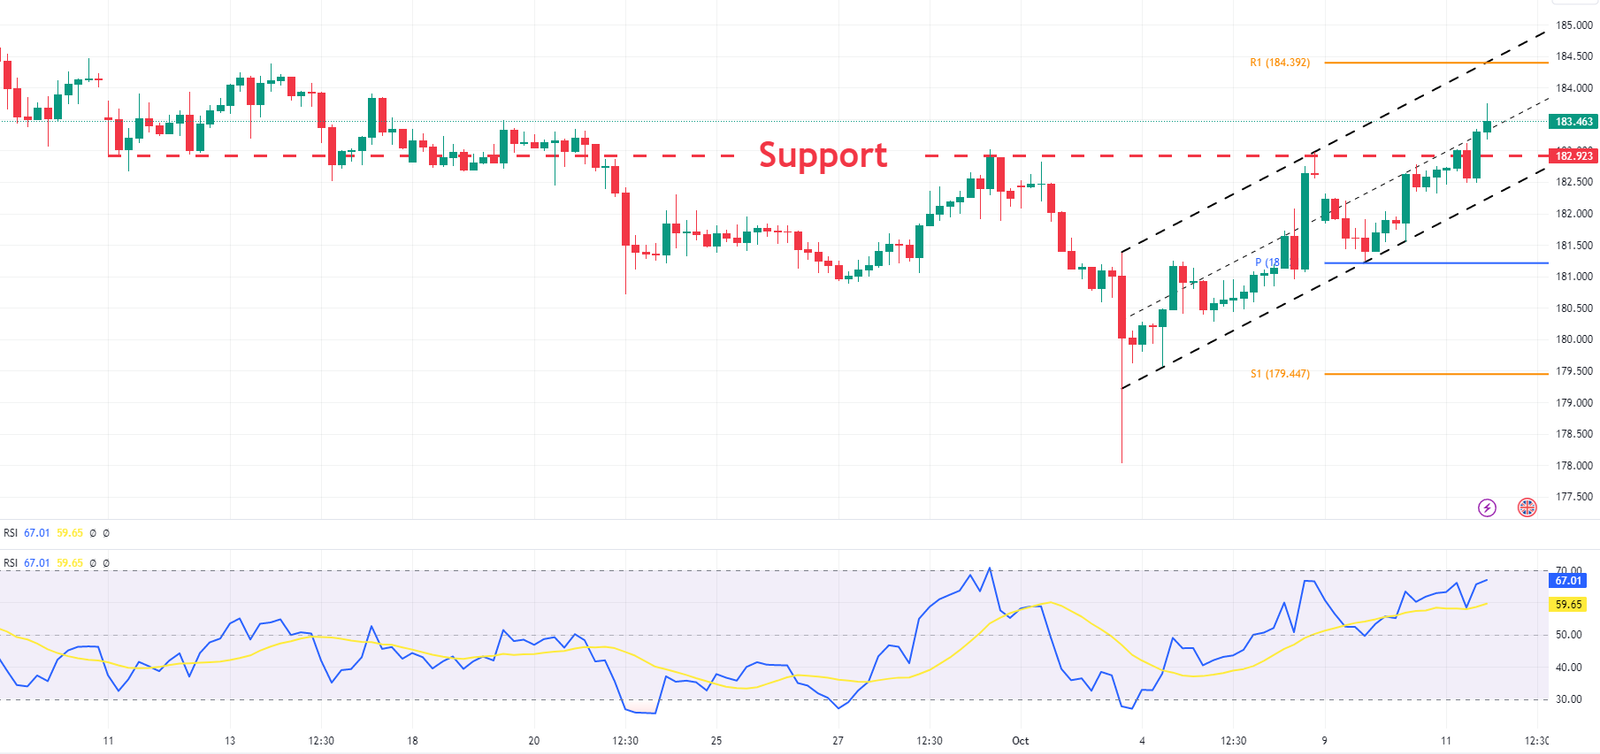
Shifting our focus to the GBP/JPY 4H chart, we observe that the currency pair has formed a new trend within the bullish channel. The RSI indicator is nearing the overbought area, indicating strong buying momentum.
- Also, read GBPJPY Technical Analysis – A Bearish Slide
However, we suggest that bulls exercise caution and allow the currency pair to test the broken support around 182.9. This level offers a decent bid for entering long positions.

If the price remains within the bullish channel, our target for GBPJPY would be the 184.39 resistance level. This comprehensive analysis provides traders with key insights into market trends and potential trading opportunities in the GBPJPY market.