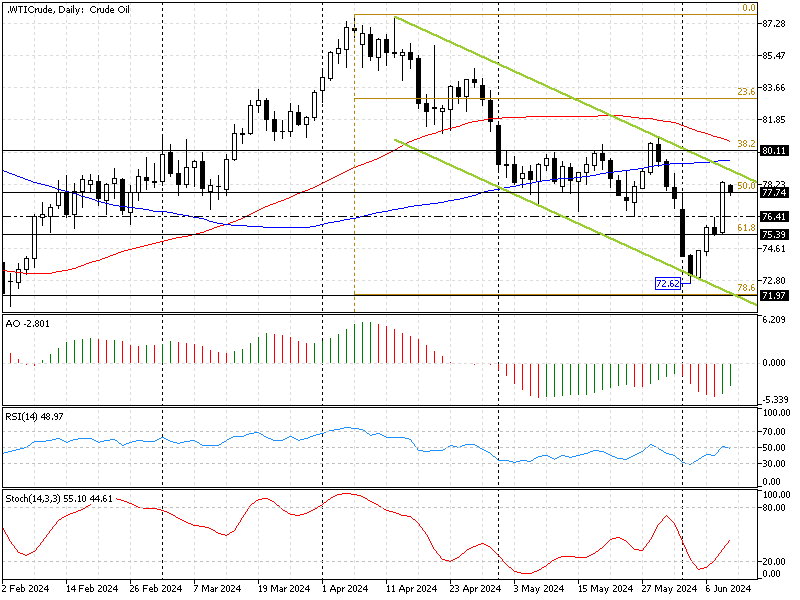
FxNews—The crude oil pullback from the lower line of the bearish flag at $72.6 cooled down after the black gold reached the upper line of the flag. As of writing, Oil tests the 50% Fibonacci retracement level as resistance at approximately $77.7.

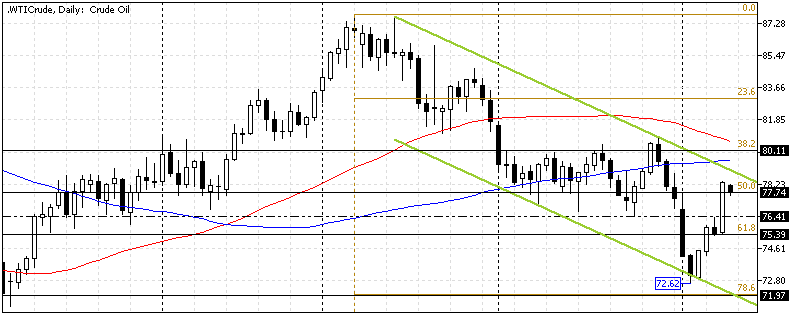
The Crude Oil daily above shows the primary trend is bearish because the price ranges inside the bearish flag. But the awesome oscillator bars changed their colors to green, showing -2.8 in the value and rising. This development in the AO’s bars suggests the downtrend weakens.
Crude Oil Technical Analysis – 11-June-2024

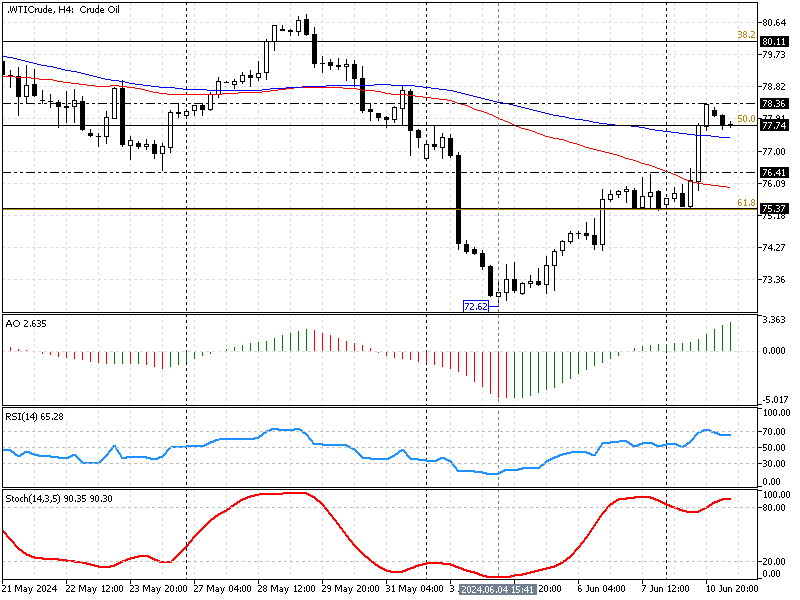
The Oil price crossed above the simple moving average of 100 in the 4-hour chart, which means the trend might reverse from bearish to bullish. Interestingly, the rise in the oil price has driven the stochastic oscillator into overbought territory, meaning the Oil is overpriced in the short term. When a trading asset is overbought, the value could decline and test lower support levels.
- The relative strength index value is 64 and declining, signifying that the bullish bias is dimming. The market might move sideways or dip to test the broken simple moving average of 50.
- On the other hand, the awesome oscillator bars stand tall and green above the signal line, showing 2.6 in the description. This climb in the AO bars suggests the bull market prevails in the short term.
These developments in the oil 4-hour chart suggest that the bull market is robust, but the trend might move sideways or consolidate to lower support levels before the uptrend resumes.
Crude Oil Price Forecast – 11-June-2024

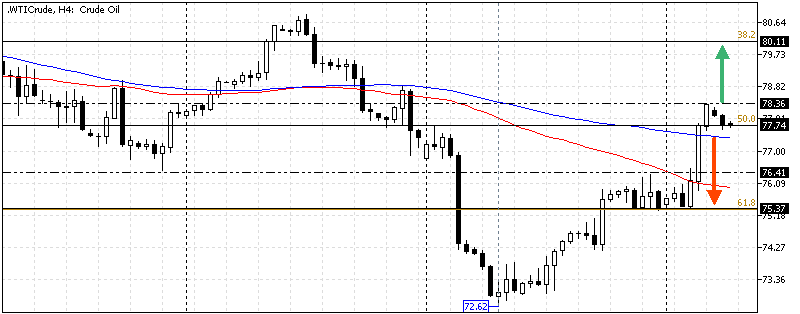
Currently, the pair tests the 50% Fibonacci support level at $77.7, near the simple moving average of 50. The stochastic oscillator in the 4-hour chart is in overbought territory, so the price might decline from this point.
If the oil price dips below the SMA 100 and stabilizes itself below the 50% Fibonacci, the correction phase can extend to immediate support at $76.4. The immediate support is backed by a simple moving average of 50, and if the price exceeds $76.4, the 61.8% Fibonacci at $75.3 could be the next target.
This scenario should be invalidated if bulls push the price above yesterday’s high of $78.3.
Bullish Scenario

The daily chart shows the Oil price range downtrend in the bearish flag. For the current uptrend to resume, the bulls must maintain a position above SMA 100 and 50% Fibonacci at approximately $77.7. If this occurs, the bullish trajectory started from $72.6 could target the %38.2% Fibonacci at $80.1.
The simple moving average of 50 supports the bullish scenario.
- Next read: Crude Oil Technical Analysis – 25-June-2024
Crude Oil Key Support and Resistance Level
Traders and investors should closely monitor the key levels below to make informed decisions and adjust their strategies accordingly as market conditions shift.
- Support: $76.4 / $75.37
- Resistance: $78.3 / $80.1