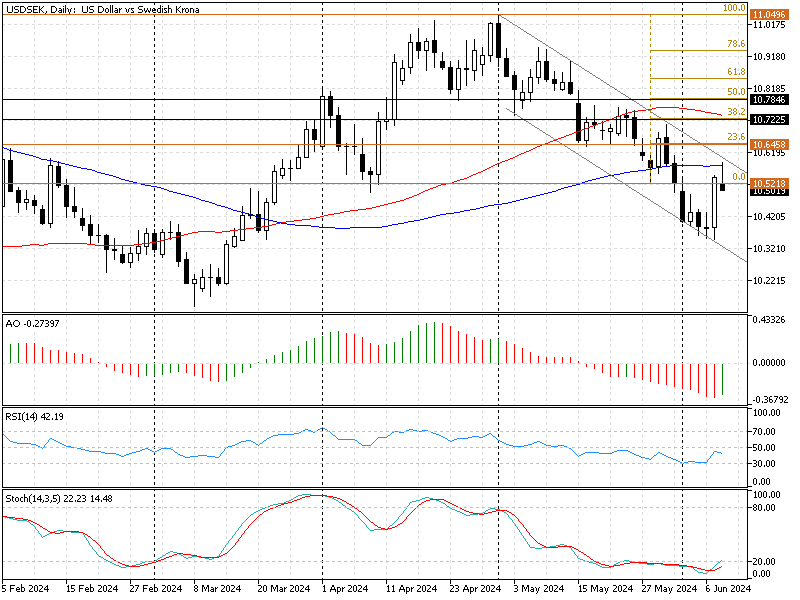
FxNews—The American currency has been in the bearish channel against the Swedish Krona since April 30, after the price peaked at 11.04. The bearish bias eased after the USD/SEK exchange rate hit the 10.34 low on June 6, which dove the stochastic oscillator into the oversold area.
As a result, the price pulled back with a solid bullish trajectory, and the simple moving average of 50 was tested, as depicted in the daily chart below.
As of writing, the USD/SEK price has returned to its downtrend trajectory, stabilizing itself below the 23.6% Fibonacci level at approximately 10.49. The daily chart below shows the Fibonacci level, technical indicators, and the bearish channel in the daily chart.

USDSEK Technical Analysis – 10-June-2024

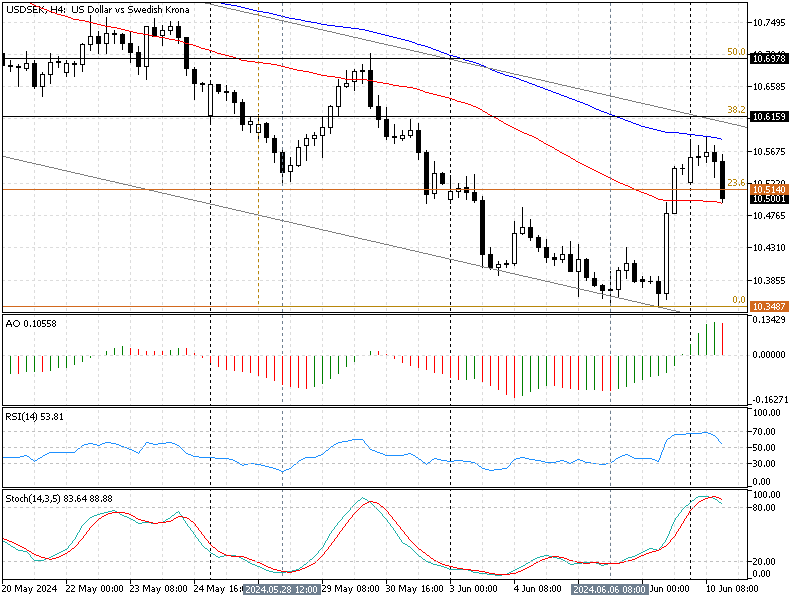
The primary trend is bearish, and the technical indicators in the 4-hour chart suggest the downtrend will likely continue.
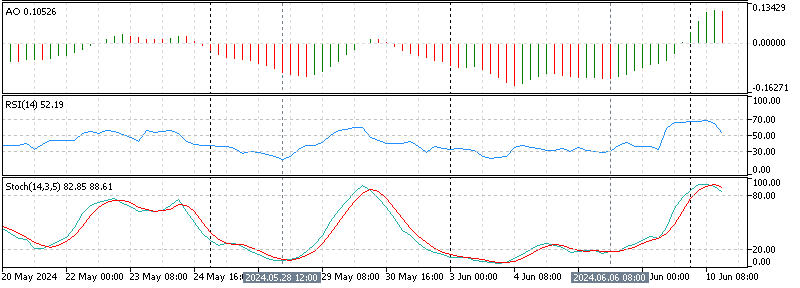
- The awesome oscillator value is 0.1, and the bars are above the signal line, but the very recent bar changed the color to red. This means the bullish pullback that began on June 6 weakens.
- The relative strength index is declining. Currently, it shows 53, meaning the bearish momentum is gaining strength.
- The stochastic oscillator %K line crossed below the D line in overbought territory, signifying that the USD/SEK exchange rate is overpriced and that the downtrend will likely resume.
USDSEK Forecast – 10-June-2024

The immediate support is the simple moving average of 50, which is at 10.497, the current USD/SEK price. From a technical standpoint, the primary trend is bearish, and for it to continue, the bears must close and stabilize the price below SMA 50. If this scenario comes into play, the decline initiated today could lead the price to dip to 10.34, which is the June 6 low.
The upper band of the bearish flag, which coincides with 38.2% Fibonacci at 10.61, is the resistance to the bearish scenario.
Bullish Scenario
On the flip side, if the bulls push the USD/SEK price above the 38.2% Fibonacci at 10.615, the consolidation phase that began on June 6 could extend to the 50% Fibonacci at 10.69. Furthermore, if the buying pressure exceeds 10.69, the bull’s road to the 61.8% Fibonacci at 10.78 could be paved.
USD/SEK Key Support and Resistance Levels
Traders and investors should closely monitor the key levels below to make informed decisions and adjust their strategies accordingly as market conditions shift.
- Support: 10.5 / 10.34
- Resistance: 10.61 / 10.69 / 10.78
Disclaimer: This technical analysis is for informational purposes only. Past performance is not necessarily indicative of future results. Foreign exchange trading carries significant risks and may not be suitable for all investors. Always conduct your research before making any investment decisions.