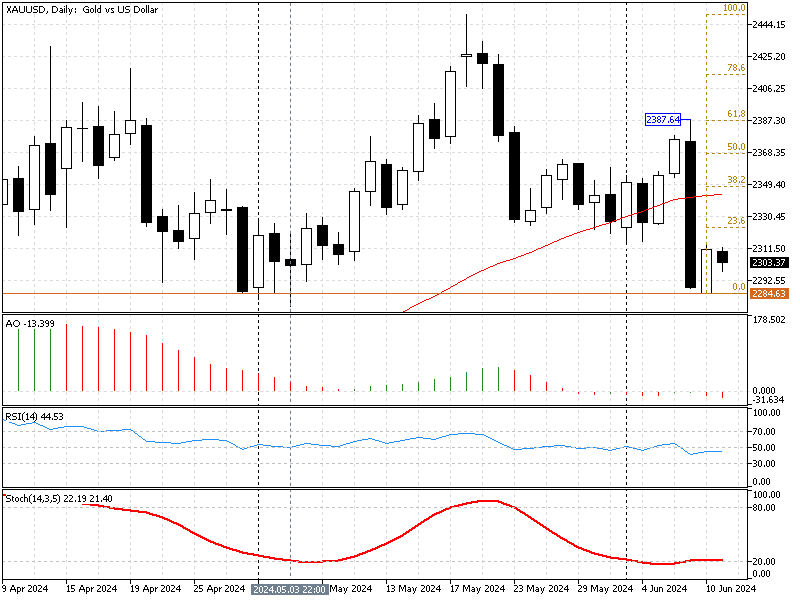
FxNews—The gold price slumped from the 61.8% Fibonacci level at $2,387 on June 7. The bearish trajectory cooled after the market neared May’s lowest rate at approximately $2,284. As of writing, XAU/USD pulls back from May’s low, trading at about $2,302, testing the 78.6% Fibonacci.
The daily chart below shows the technical indicators and the Fibonacci level in the daily chart.

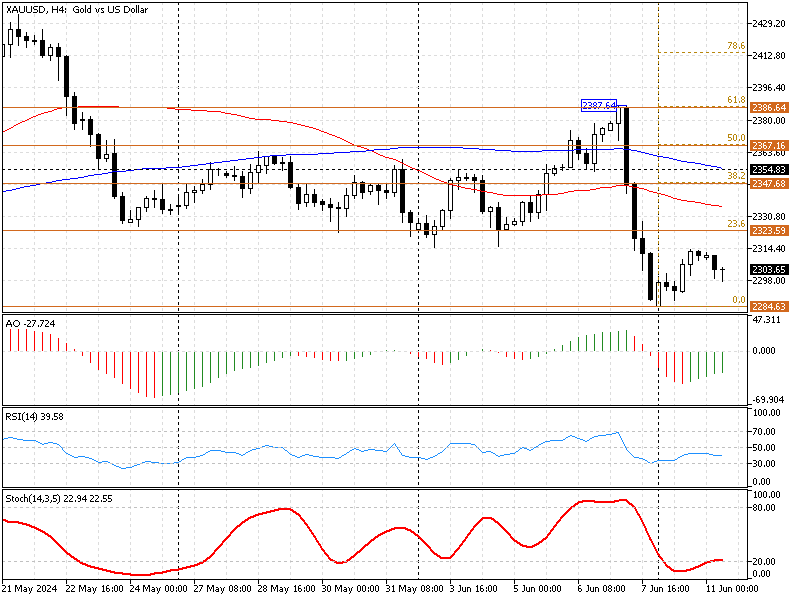
XAUUSD Technical Analysis – 11-June-2024
- The price is below the simple moving average of 50 and 100, indicating Gold is in a bear market.
- The stochastic oscillator value is 22, returning from the oversold territory, meaning the market was oversold, and the price might rise and consolidate.
- The relative strength index value is 38, moving alongside the median line, suggesting the XAU/USD market doesn’t have a significant trend. It is not either overbought or oversold.
- The awesome oscillator bars are green, depicting -27 in the value and rising, but the bars are below the signal line. This climb in the AO value signifies the bullish momentum gains strength.

These developments in the XAU/USD 4-hour chart suggest the primary trend is bearish, but the price might consolidate and move sideways for a short while.
XAUUSD Price Forecast – 11-June-2024

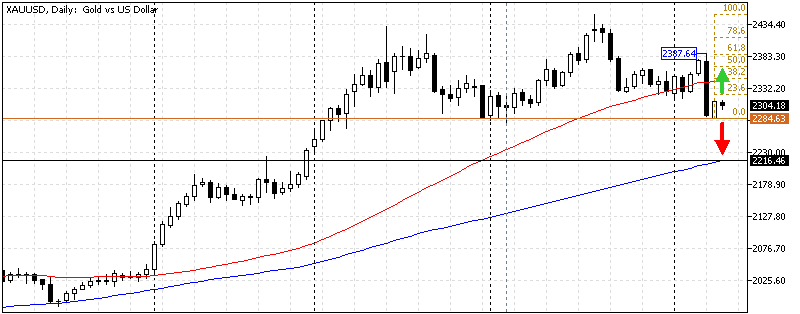
The immediate resistance for the current downtrend is the 23.6% Fibonacci at $2,323. The bulls tested this level in today’s trading session, and as of this writing, the gold price has returned from the immediate resistance.
From a technical standpoint, as long as the Gold price remains below the $2,323 resistance, it will likely test May’s all-time low at $2,277. If selling pressure exceeds this level, the next resistance is the SMA 100 at $2,216.
The simple moving average of 50 is the key resistance for the bearish scenario, which should be invalidated if the price exceeds the SMA 50.
Bullish Scenario
As mentioned earlier, the immediate barrier for the bulls is $2,323. If the gold price breaches this level, the pullback from $2,284 could extend to $2,347, followed by the 38.2% Fibonacci level at $2,347. If the buying pressure exceeds this level, the next target could be June’s all-time high at $2,386.
Gold Key Support and Resistance Levels
Traders and investors should closely monitor the key levels below to make informed decisions and adjust their strategies accordingly as market conditions shift.
- Support: $2,284 / $2,216
- Resistance: $2,314 / $2,343 / $2,363
Disclaimer: This technical analysis is for informational purposes only. Past performance is not necessarily indicative of future results. Foreign exchange trading carries significant risks and may not be suitable for all investors. Always conduct your research before making any investment decisions.