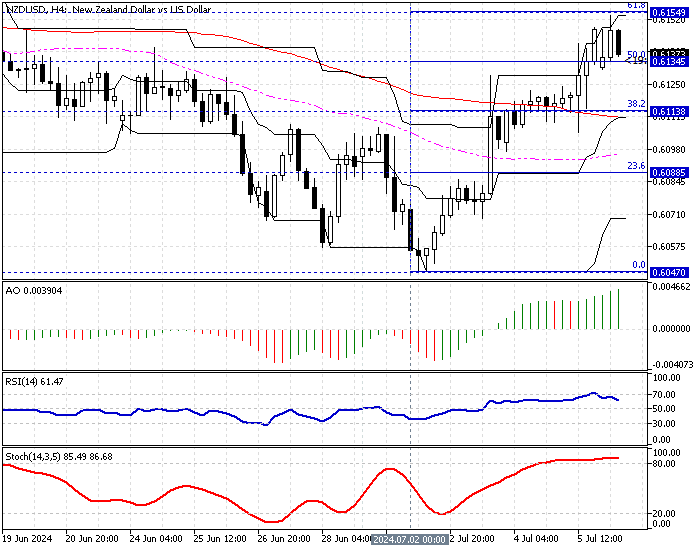
FxNews—The New Zealand dollar has been in an uptrend against the U.S. dollar since July 2nd. In today’s trading session, the NZD/USD pair price is at approximately $0.614, testing the 50% Fibonacci level at $0.613 as support. The 4-hour chart below demonstrates the current price of the trading asset, the key Fibonacci levels, and the technical tools utilized in today’s analysis.

NZDUSD Technical Analysis – 8-July-2024
The technical indicators in the NZD/USD 4-hour chart suggest the primary trend is bullish, but New Zealand’s currency might be overpriced.
- The awesome oscillator bars are green and above zero. The value of the AO is 0.003 at the moment and rising. This growth in the indicator’s value means the bull market prevails.
- The relative strength index indicator value is 63, which returned below the overbought territory, signifying that bullish momentum weakened.
- The stochastic oscillator floats in the overbought territory, showing a value of 86 in the description. This means the NZD/USD is overbought, and the market might consolidate or dip to test the lower support levels.
- The price is above the 50- and 100-period simple moving averages, which signifies an uptrend.
NZDUSD Price Forecast – 8-July-2024

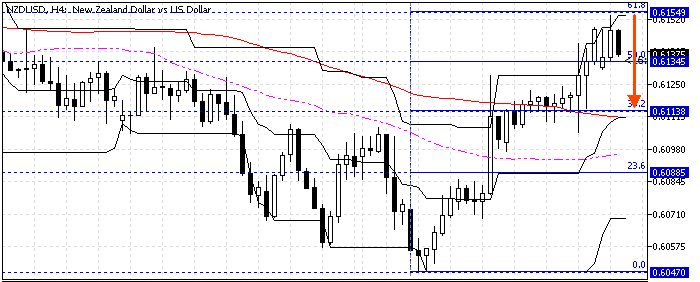
As of writing, the NZD/USD price returned from the 61.8% Fibonacci retracement level at $0.615, testing the 50% Fibonacci at $0.613. This price decline was expected because the stochastic oscillator is in overbought territory.
From a technical standpoint, the NZD/USD currency pair is in a bull market, but the exchange rate is overpriced, which could result in a price dip. The immediate support is at the 50% Fibonacci at $0.613. If the bears (sellers) push the price below the immediate support ($0.613), the next support level that could be tested will likely be the 38.2% Fibonacci at $0.611, a level backed by the 100-period simple moving average.
Furthermore, if the price falls below the $0.611 support, the bullish market should be invalidated, and the NZD/USD price can fall further to the 23.6% Fibonacci at $0.6088.
The 61.8% Fibonacci resistance level at $0.615 is the key resistance to the bearish scenario. If the bulls exceed this ceiling, the bearish scenario should be invalidated accordingly.
NZD/USD Bullish Scenario
Buying an asset in an overbought market is not recommended, and NZD/USD is in such a situation with a stochastic oscillator value above 80. That said, the 38.2% Fibonacci level at $0.611 offers a decent bid for traders and investors to join the uptrend. Therefore, the $0.611 resistance area should be monitored closely for bullish signals, such as bullish candlestick patterns.
The bullish scenario should also be invalidated if the price dips and stabilizes below $0.611.
NZDUSD Key Levels – 8-July-2024
Traders and investors should closely monitor the key levels below to make informed decisions and adjust their strategies accordingly as market conditions shift.
- Support: $0.613 / $0.611 / $0.6088
- Resistance: $0.615 / $0.618
Disclaimer: This technical analysis is for informational purposes only. Past performance is not necessarily indicative of future results. Foreign exchange trading carries significant risks and may not be suitable for all investors. Always conduct your research before making any investment decisions.