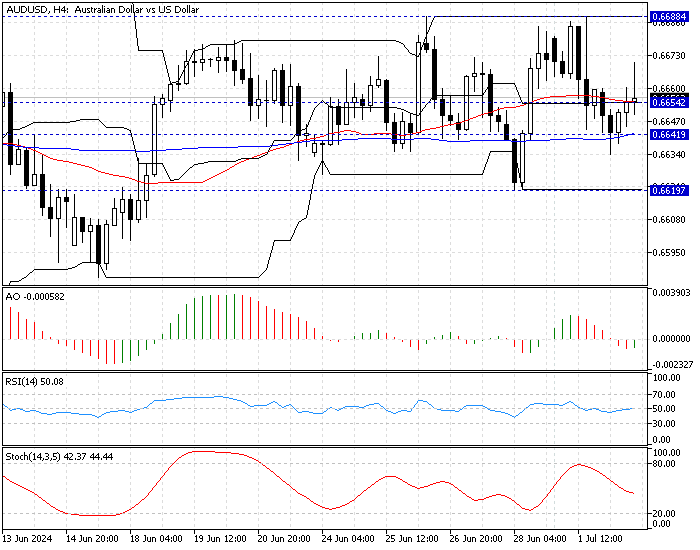
FxNews—The Australian dollar has traded sideways against the U.S. Dollar since mid-June. As of writing, the AUD/USD currency pair trades at about $0.665, trying to close above the 50-period simple moving average.
The 4-hour chart below shows the key technical levels of the AUD/USD pair and the essential technical tools utilized in today’s analysis.

AUDUSD Technical Analysis – 2-July-2024

The technical indicators in the 4-hour chart give mixed signals, suggesting the market lacks direction and moves sideways.
- The awesome oscillator bars are small and below zero, but the recent bar turned green, indicating the trend lacks momentum. However, it could be mildly bullish.
- The RSI 14 clinging to the median line, pointing out the slow and uncertain market.
- The stochastic oscillator declining and hovering around 44 shows the market has a bearish bias.
AUDUSD Forecast – 2-July-2024

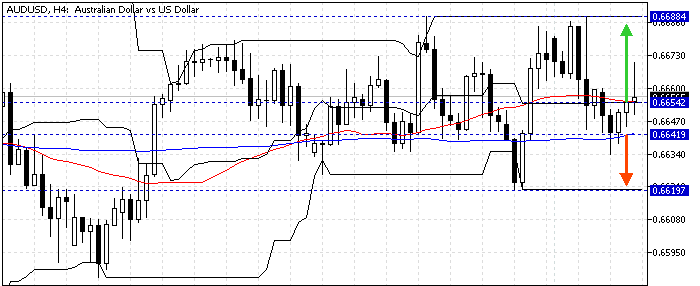
Currently, the AUD/USD price is above the 100- and 50-period simple moving averages. Despite the other technical indicators, this suggests the market has bullish tendencies. Therefore, the price might rise to test the June 26 high at $0.668. For the scenario to come into play, the bulls must maintain a position above the 50 SMA.
The key resistance to the bullish strategy is the 100-period SMA; if the price flips below $0.664, the bullish scenario should be invalidated.
AUDUSD Bearish Scenario – 2-July-2024
The key resistance level is a 100-period simple moving average of $0.664. If the bears (sellers) close a candle below this level, the dip that began at $0.668 will likely retest the June 28 low at $0.661.
The key resistance to the bearish scenario is the median line of the Donchian channel at $0.665. Should the price close below $0.665, the bearish strategy should be invalidated accordingly.
AUDUSD Key Support and Resistance Levels – 2-July-2024
Traders and investors should closely monitor the key levels below to make informed decisions and adjust their strategies accordingly as market conditions shift.
- Support: $0.664 / $0.661
- Resistance: $0.665 / $0.668
Disclaimer: This technical analysis is for informational purposes only. Past performance is not necessarily indicative of future results. Foreign exchange trading carries significant risks and may not be suitable for all investors. Always conduct your research before making any investment decisions.