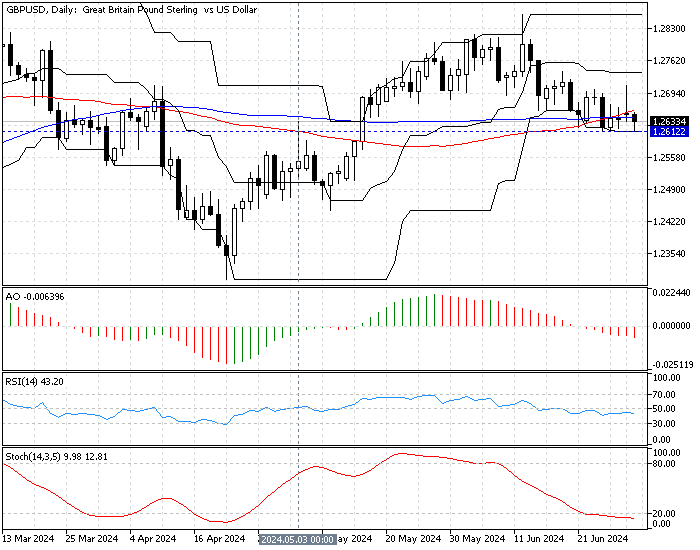
FxNews—The Pound sterling’s dip against the U.S. dollar eased near the key resistance level at $1.261, the May 3rd high. The recent development in the dollar’s value has driven the stochastic oscillator below the 20 levels in the daily chart, meaning the American currency is overpriced against the British currency.
Therefore, the price might bounce from the key support level and test the upper resistance areas. The GBP/USD daily chart below demonstrates the current price and the essential technical tools used in today’s analysis.

GBPUSD Technical Analysis – 2-July-2024
The technical indicators in the daily chart suggest the primary trend is bearish, but the market might be oversold.

- Awesome oscillator bars are red and below zero, meaning the downtrend prevails.
- The relative strength index indicator is below the median line but moving sideways, with a value of 43. This means the market suffers from a lack of momentum; it is not overbought or oversold.
- The stochastic oscillator is in oversold territory, with the %K line value at 12, which indicates that the GBP/USD is oversold and that a consolidation phase or a trend reversal might be on the horizon.
GBPUSD Forecast – 2-July-2024

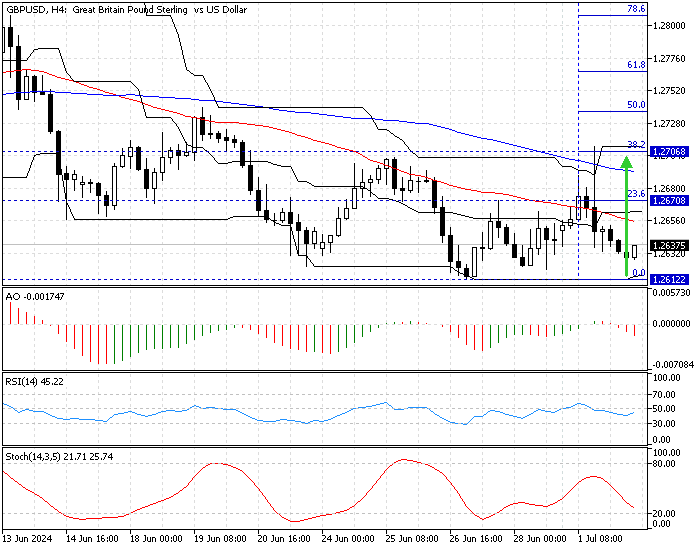
The key resistance holding the robust downtrend is at $1.261, which coincides with the June 3 high. The price has reacted multiple times to this level, which can cause the Pound Sterling to erase some of its losses against the U.S. Dollar.
From a technical standpoint, if the key resistance at $1.261 holds, the GBP/USD price could rise to test the 23.6% Fibonacci level at 1.267. If the buying pressure exceeds this level, the next bullish target could be testing yesterday’s high at 1.270, a resistance area backed by the 38.2% Fibonacci level.
Notably, the $1.261 is the key resistance. If the bears (sellers) close and stabilize the price below the key level, the bullish scenario should be invalidated.
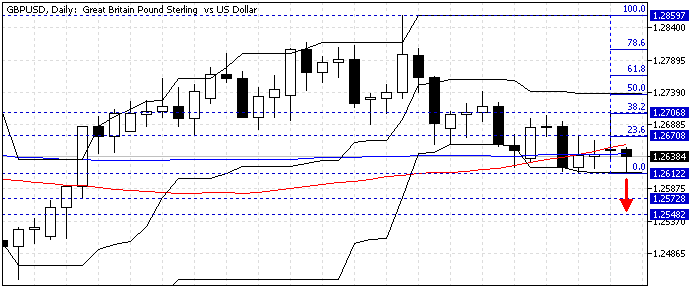
GBPUSD Bearish Scenario – 2-July-2024

If the bears push the GBP/USD price below the key resistance level at $1.261, the bearish wave initiated from $1.258 will likely extend to the next supply zone at about $1.257. Furthermore, if the price dips below $1.257, the next resistance will be $1.254.
GBPUSD Key Support and Resistance level – 2-July-2024
Traders and investors should closely monitor the key levels below to make informed decisions and adjust their strategies accordingly as market conditions shift.
- Support: $1.261 / $1.257 / $1.254
- Resistance: $1.267 / $1.270
Disclaimer: This technical analysis is for informational purposes only. Past performance is not necessarily indicative of future results. Foreign exchange trading carries significant risks and may not be suitable for all investors. Always conduct your research before making any investment decisions.