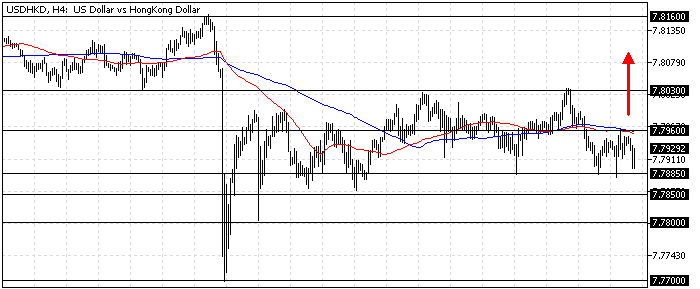
FxNews—The U.S. Dollar is trading sideways against the Hong Kong Dollar in a wide range between the 7.785 support (August 8 low) and 7.803 (September 12 High).
As of this writing, the USD/HKD currency pair trades at approximately 7.791. The daily chart below demonstrates the price, key support and resistance levels, and the technical indicators utilized in today’s analysis.

USDHKD Technical Analysis – 20-September-2024
The daily chart shows that the currency pair’s price in discussion is below the 50- and 100-period simple moving averages, meaning the primary trend is bearish.
Interestingly, the USD/HKD bulls tested the 50-period simple moving average at 7.803 on September 12 but failed to surpass this resistance area. As a result, the downtrend triggered again, but it eased when the price dipped to the September 6 low at 7.788 support.

Zooming into the 4-hour chart, the Awesome oscillator shows a divergence in its histogram, indicating that the USD/HKD price might enter a new consolidation phase or that a new bullish wave could be on the horizon.
- The RSI 14 and Stochastic oscillator hover in the middle, demonstrating a low volatile market.
Overall, the technical indicators in the USD/HKD 4-hour chart suggest a low momentum market. Hence, sideways trading will probably resume until the pair breaks one of the key support and resistance levels.
USDHKD Forecast – 20-September-2024

The immediate resistance rests at 7.788. If the bears push the price below 7.788, the downtrend that began on September 13 could extend to 7.785. Furthermore, if the USD/HKD price dips below 7.785, the next support level will be 7.78, followed by 7.77.
Please note that the bearish scenario should be invalidated if the USD/HKD price crosses and closes above the 100-period simple moving average.
- Also read: USD/SGD Forecast – 19-September-2024
USDHKD Bullish Scenario – 20-September-2024

The immediate resistance is at 7.796, in conjunction with the 100-period SMA, 50-period SMA, and the September 19 high. If bulls (buyers) close and stabilize prices above 7.796, the current uptick momentum could target 7.803.
USDHKD Support and Resistance Levels – 20-September-2024
Traders and investors should closely monitor the key levels below to make informed decisions and adjust their strategies accordingly as market conditions shift.
- Support: 7.788 / 7.785 / 7.80 / 7.770
- Resistance: 7.796 / 7.803