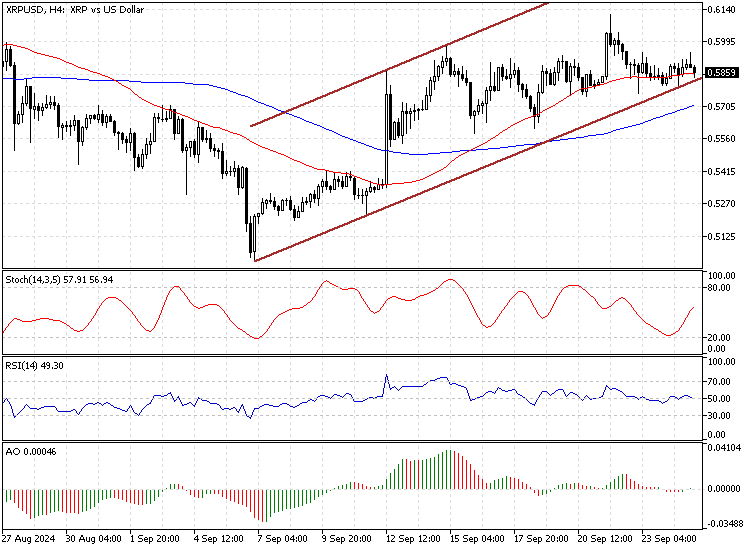
FxNews—Ripple (XRP) has been in a mild bull market since its September 7 low of $0.5. The 50—and 100-period simple moving averages made a gold cross on September 12, and as of this writing, the XRP/USD trades at approximately $0.58.
The 4-hour chart below demonstrates the price, support and resistance levels, and technical indicators utilized in today’s analysis.

Ripple Technical Analysis – 25-September-2024
As the image above shows, XRP is in an uptrend and is currently testing the ascending trendline, which neighbors the $0.575 support, the September 23 low.
- The Stochastic oscillator and RSI 14 hover in the middle, signaling a low momentum market. This is evident in the 4-hour chart, as the candles are small and moving sideways this week.
- The Awesome oscillator bars are small and clinging to the signal line, indicating a range market.
Overall, the technical indicators suggest the primary trend is bullish, but the market has entered a consolidation phase.
Ripple (XRP) Forecast – 25-September-2024

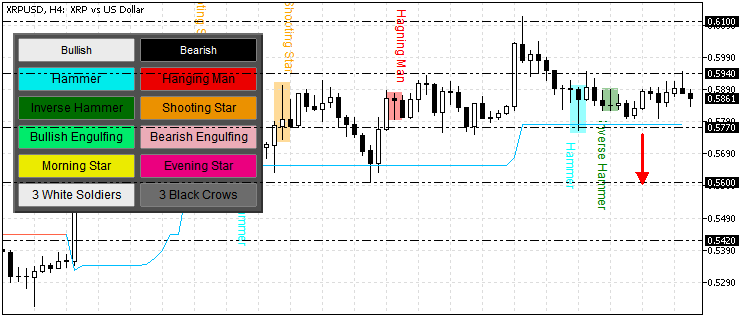
The immediate resistance is at $0.549 (September 23 High). From a technical perspective, the uptrend will likely resume if the bulls (buyers) cross and stabilize the price above $0.594.
If this scenario unfolds, the uptrend could potentially target $0.61 (September 21 High), followed by $0.63 (September 24 High).
Ripple (XRP) Bearish Scenario – 25-September-2024

Immediate support rests at $0.577, which coincides with the Supertrend indicator. If the bears (sellers) close and stabilize below $0.577, the consolidation phase could spread to the next support area at $0.56 (September 16 Low).
Furthermore, if the selling pressure pushes the price below $0.56, the next seller’s target could be the September 11 high at $0.542.
Ripple (XRP) Support and Resistance – 25-September-2024
Traders and investors should closely monitor the key levels below to make informed decisions and adjust their strategies accordingly as market conditions shift.
- Support: $0.577 / $0.560 / $0.542
- Resistance: $0.594 / $0.610 / $0.630