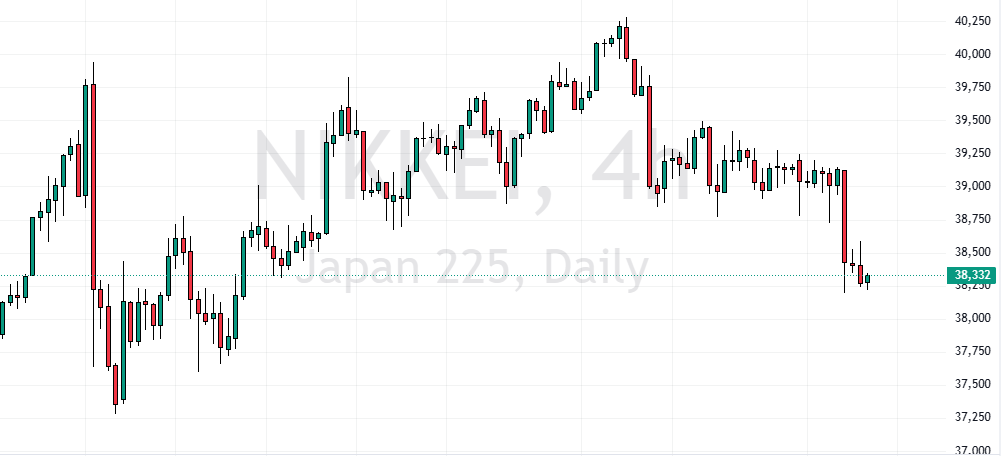
FxNews—In Tokyo, the Nikkei 225 Index dropped by 434 points, a decrease of 1.11%, on Tuesday. The largest declines were seen in M3, which fell by 4.74%, followed by Toto and Ebara, both decreasing by 3.94%.

GBPJPY Technical Analysis – 22-October-2024

The British pound trades bullish against the Japanese yen at approximately 195.2, above the 4-hour chart 100-period simple moving average. The market has been moving sideways for over a week as the Bollinger Bands narrowed its lines.
However, the primary trend should be considered bullish because despite the price being above the 100-SMA, it is also above the Ichimoku Cloud.

Furthermore, the RSI 14 clings to the median line, indicating that the market is neither bullish nor bearish. Additionally, the Awesome oscillator bars are small, moving gradually toward the signal line, meaning the market lacks momentum but is mildly bearish.
Overall, the technical indicators suggest that while the primary trend is bullish, the GBP/JPY lacks momentum. Hence, the price could break in one direction and make the trend bullish or bearish.
- Good read: GBPJPY Holds Near 196 as FTSE Gains 0.2%
GBPJPY Forecast – 22-October-2024

Immediate resistance is at the October 16 low, 193.6. The market outlook will remain bullish as long as GBP/JPY remains above this support. However, for the uptrend to resume, bulls must close and stabilize the price above the immediate resistance of 196.0.
If this scenario unfolds, the next bullish target could be the July 30 high at 199.6. Please note that the bullish outlook should be invalidated if the GBP/JPY price falls below the immediate support of 193.65.
- Editor’s pick: USD/CHF Set for Bullish Run Amid Swiss Inflation Decline
GBPJPY Bearish Scenario – 22-October-2024

If bears (sellers) push the GBP/JPY price below the immediate support of 193.65, the downtick momentum that began at 196.0 will likely extend to the October 4 low at 191.0. Furthermore, if the selling pressure exceeds 191.0, the downtrend can spread to the September 30 low at 189.9.
GBPJPY Support and Resistance Levels – 22-October-2024
Traders and investors should closely monitor the key levels below to make informed decisions and adjust their strategies accordingly as market conditions shift.
- Support: 193.65 / 191.8 / 189.9
- Resistance: 196.0 / 199.6