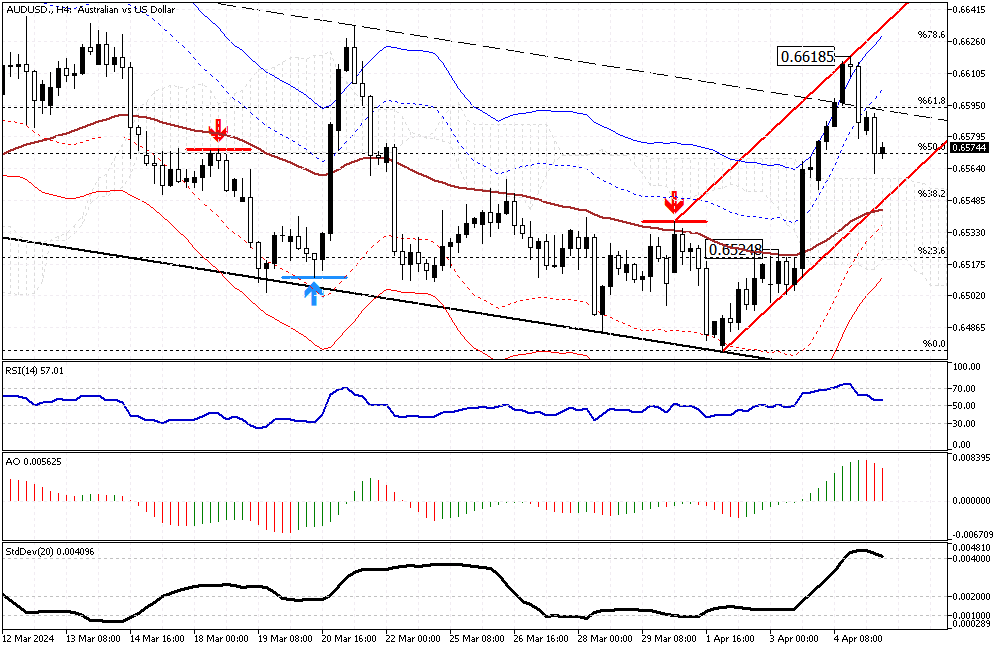
FxNews–In yesterday’s trading session, the Australian dollar broke out from the bearish flag against the U.S. Dollar. The strong uptick in momentum began after the pair crossed above the EMA 50 and 0.6524 with a long-bodied bullish candle.
The rise continued with four strong bullish candles, leading the price to drive outside the Envelopes band, interpreted as an overbought market. The RSI indicator also hinted at this by stepping above the 70 level.
The AUDUSD 4-Hour Analysis

As a result, today, the market is experiencing a pullback from Thursday’s high of 0.661. When writing, the AUDUSD pair trades at about 0.657, above the 50% Fibonacci support, and stabilizes itself above the Ichimoku Cloud. Interestingly, the indicators are still bearish, but from a technical standpoint, as long as the pair hovers above the cloud and the EMA 50, the primary trend will be bullish.
AUDUSD Potential Rise to 0.6626
According to our technical analysis for the AUDUSD currency pair, the price of the pair could start a new bullish wave from this pullback and test the 78.6% Fibonacci resistance level (the 0.6626 mark), followed by the upper band of the bullish channel depicted in red on the 4-hour chart above.
AUDUSD Bull Market: What Could Go Wrong?
Conversely, the bull market should be invalidated if the price dips below the EMA 50 or the 38.2% Fibonacci support (the 0.5548 mark).