Discover the latest Bitcoin analysis with our expert insights. We regularly update our Bitcoin technical analysis, shedding light on the trend direction and technical indicators. At the end, we provide a detailed Bitcoin forecast based on current economic data.
So, if you are a fan of trading cryptocurrencies, stay with us and bookmark this page to make informed trading decisions.
Table of Contents
Bitcoin Live Chart
The BTC/USD live chart below is from TradingView, a reliable source and platform endorsed by traders and investors worldwide. I featured the chart with my favorite indicators, which I utilize in almost all of my technical analyses.
Bitcoin Technical Analysis – 27, 1, 2025
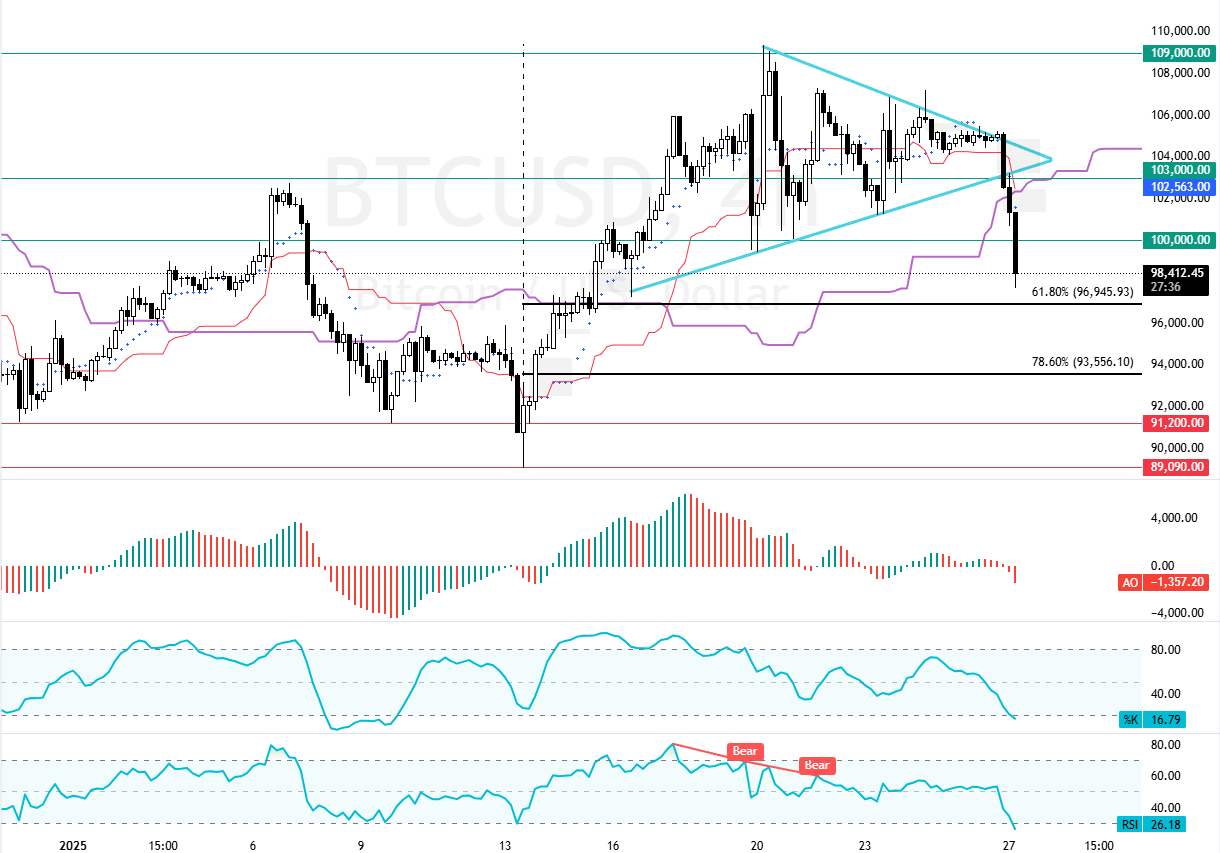
FxNews—The digital gold is in a bear market, trading below the leading span B of the Ichimoku cloud in the 4-hour chart. The downtrend began at $106,000 after bulls failed to push the prices above the symmetrical triangle. Consequently, a new bearish wave began, pushing BTC below $100,000.
As of this writing, BTC/USD trades at approximately $98,800 and lost 3.7% in today’s trading session.
What Do Technical Indicators Reveal?
- The RSI 14 value is 25.0 and declining, meaning BTC is oversold.
- The Stochastic Oscillator value is 15.0 and declining, supporting RSI’s oversold signal.
- The Awesome Oscillator histogram is red, below zero, interpreted as the bear market should prevail.
Overall, the technical indicators suggest that while the primary trend is bearish, Bitcoin can potentially rise and test upper resistance levels.
Bitcoin Forecast: The Bearish Scenario
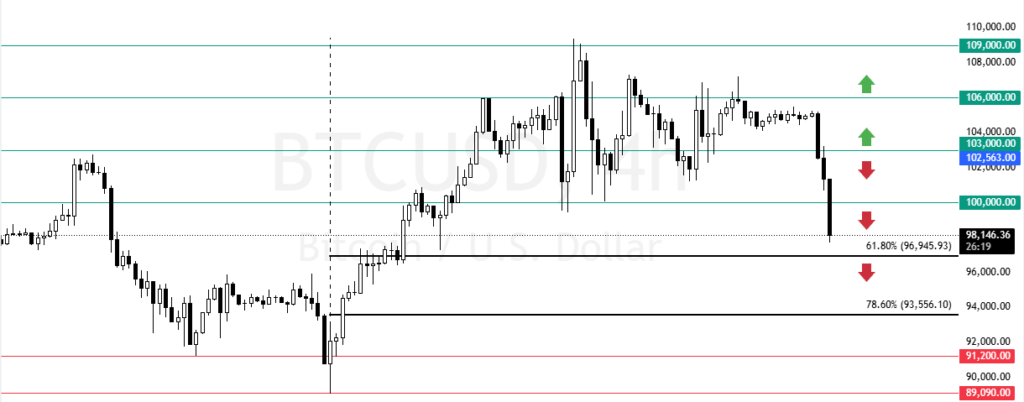
The immediate resistance is at $103,000. From a technical standpoint, the market outlook remains bearish as long as BTC/USD trades below $103,000. If this scenario unfolds, the next bullish target could be the January 20 high at $109,000.
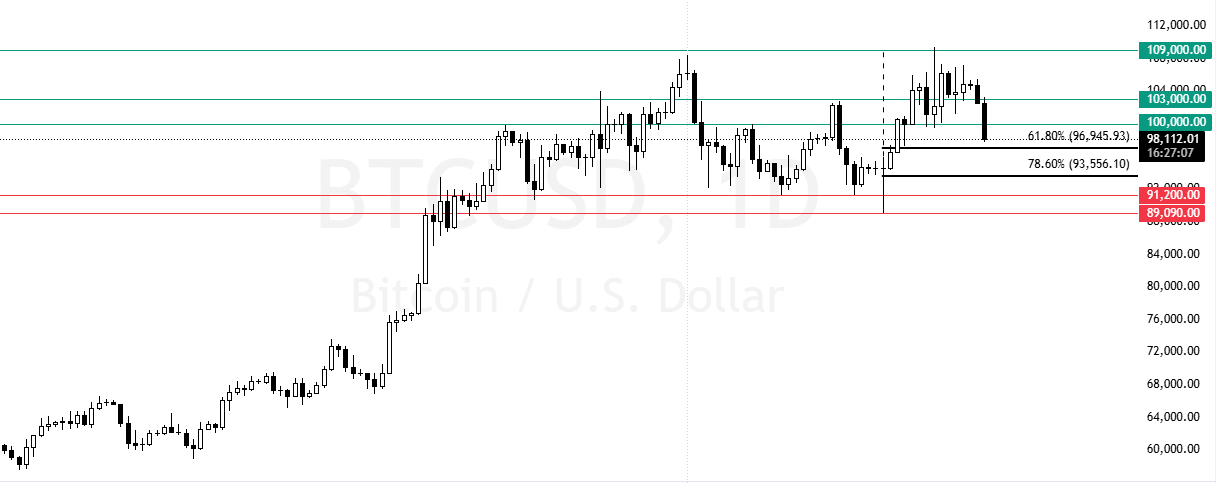
However, be aware that Bitcoin is oversold. Therefore, going short at the current price is not recommended. Retail traders and investors should wait patiently for the BTC to consolidate near upper resistance levels because it can bounce from the 61.8% Fibonacci retracement level.
In this scenario, we suggest monitoring the $103,000 for bearish signals such as candlestick patterns. If the $103,000 resistance holds, Bitcoin can potentially fall toward the 78.6% Fibonacci support level at $93,500.
The Bullish Scenario
The immediate resistance is at $103,000. From a technical perspective, the downtrend should be invalidated if BTC/USD exceeds this level.
In this scenario, the next bullish target could be the $106,000 resistance. Furthermore, if the buying pressure pushes the price above $105,000, Bitcoin could revisit the January 20 high at $109,000 as resistance.
Bitcoin Support and Resistance Levels
Traders and investors should closely monitor the BTC/USD key levels below to make informed decisions and adjust their strategies accordingly as market conditions shift.
| Bitcoin Support and Resistance Levels | |||
|---|---|---|---|
| Support | 96,900 | 93,500 | 91,200 |
| Resistance | 103,000 | 106,000 | 109,000 |
FAQ
What is Bitcoin?
This digital currency functions on a decentralized network, and its name is Blockchain. Furthermore, BTC uses cryptographic systems and techniques to secure transfers. All transactions are processed and verified by crypto miners and network nodes.
How does it work?
In 2009, an unknown person or an IT expert team created a digital currency with the pseudonym Satoshi Nakamoto. They called it Bitcoin, a peer-to-peer decentralized transaction without the need for any authority, middleman, or bank.
How do you buy Bitcoin?
Buying this digital asset via traditional means is impossible since the coins are in a network, not physical. However, you can buy Bitcoin through special ATMs or online exchanges such as Binance. That said, you need a ledger or a BTC wallet to receive the coins.
Is it legal?
The legality of cryptocurrencies depends heavily on your country and its financial legislation and regulation. Some countries, like the United States and Turkey, completely accept them, and they have official offices and rules for purchasing Bitcoin or other cryptocurrencies.
Is it safe to trade Bitcoin?
That depends on how much you know about trading! But you are in the right place. If you are a newbie and about to start trading cryptocurrencies, follow our articles to understand the current market conditions.
Once you have the confidence, you can find a reputed cryptocurrency broker to trade BTC/USD or other digital assets.
Please note that trading securities or digital assets has risks, and you might lose more than expected. Therefore, try to avoid high-leverage trading, and if you are starting, focus on demo accounts for at least a year.


