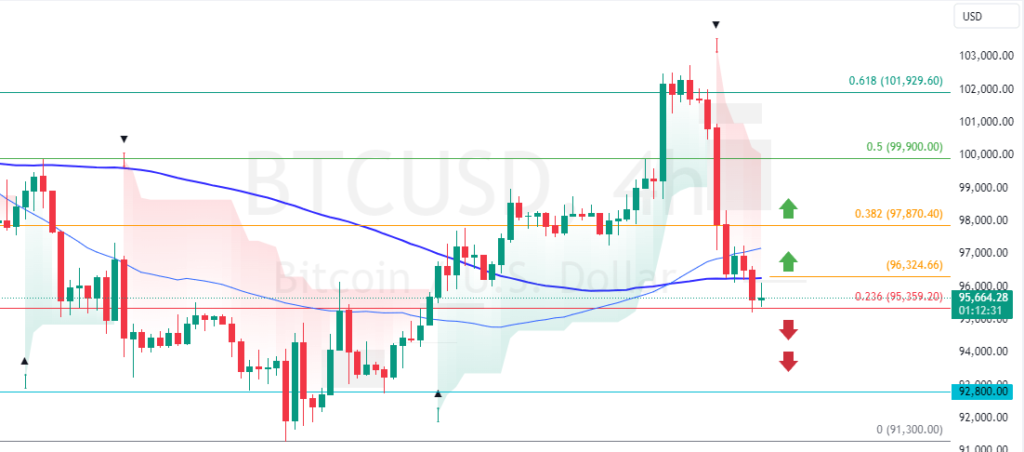
As expected, Bitcoin dipped to $95000 because the Stochastic Oscillator was overbought. A close above the immediate resistance at $96,300 can trigger the uptrend, targeting the 38.2% Fibonacci resistance level at $97,870.

Bitcoin Technical Analysis – 8-January-2025
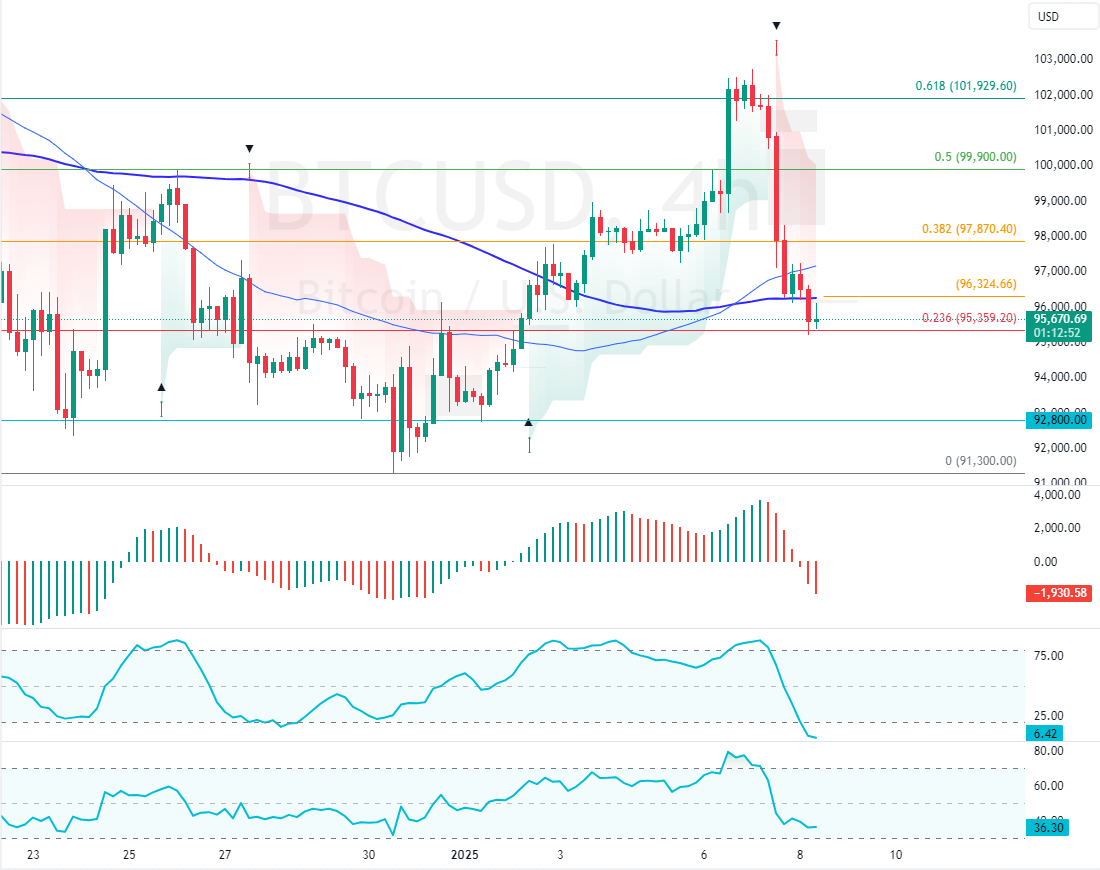
FxNews—Bitcoin has been in a bull market but flipped below the 100-period simple moving average in today’s trading session. The digital gold has lost 7.0% of its value since January 6. However, the selling pressure eased at the 23.6% Fibonacci support level.
As of this writing, the cryptocurrency trades at approximately $95,300, testing the 23.6% Fibonacci level as resistance.
Regarding the technical indicators:
- The RSI 14 depicts 36 in the description and is declining, meaning Bitcoin is not oversold, so the downtrend could extend to lower support levels.
- On the other hand, the Stochastic Oscillator shows 6.0 in the description, which is interpreted as an oversold market, hinting at a trend reversal or the start of a consolidation phase.
- The Awesome Oscillator histogram is red, below zero, indicating the bear market should prevail.
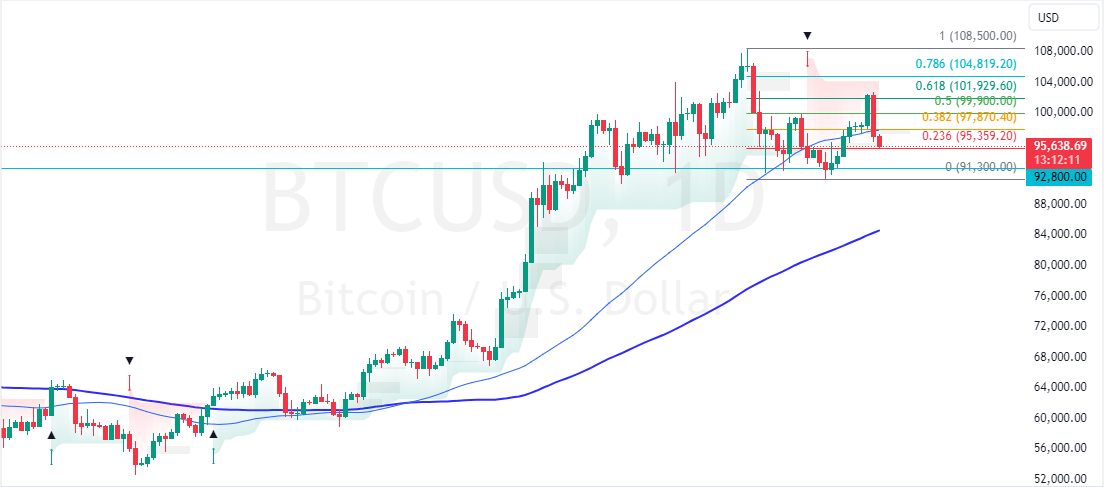
Overall, the technical indicators suggest that while the primary trend is Bullish, BTC/USD has the potential to consolidate near the upper resistance levels and begin its bullish trajectory.
Bitcoin Dipped to $95000: The Bullish Scenario

The immediate resistance is at $96,300. From a technical perspective, the uptrend could be triggered if bulls (buyers) close and stabilize BTC/USD above this mark.
If this scenario unfolds, the next bullish target could be the 38.2% Fibonacci resistance level at $97,870. Please note that the bullish strategy should be invalidated if BTC/USD exceeds $95,300.
- Bitcoin Analysis: Technical, Fundamental & News
- Litecoin Gained 7.1%: What’s the Next Target?
- Bitcoin is up 6.6% Amid Divergence Signals: What’s Next?
The Bullish Scenario
The immediate support is at $95,300, backed by the 23.6% Fibonacci level. From a technical standpoint, the downtrend from $101,900 will likely resume if Bitcoin’s value declines below $95,300. In this scenario, the next bearish target could be $92,800.
Bitcoin Support and Resistance Levels – 8-January-2025

Traders and investors should closely monitor the BTC/USD key levels below to make informed decisions and adjust their strategies accordingly as market conditions shift.
| Bitcoin Support and Resistance Levels – 8-January-2025 | |||
|---|---|---|---|
| Support | $95,300 | $92,800 | $91,300 |
| Resistance | $96,300 | $97,870 | $99,900 |


