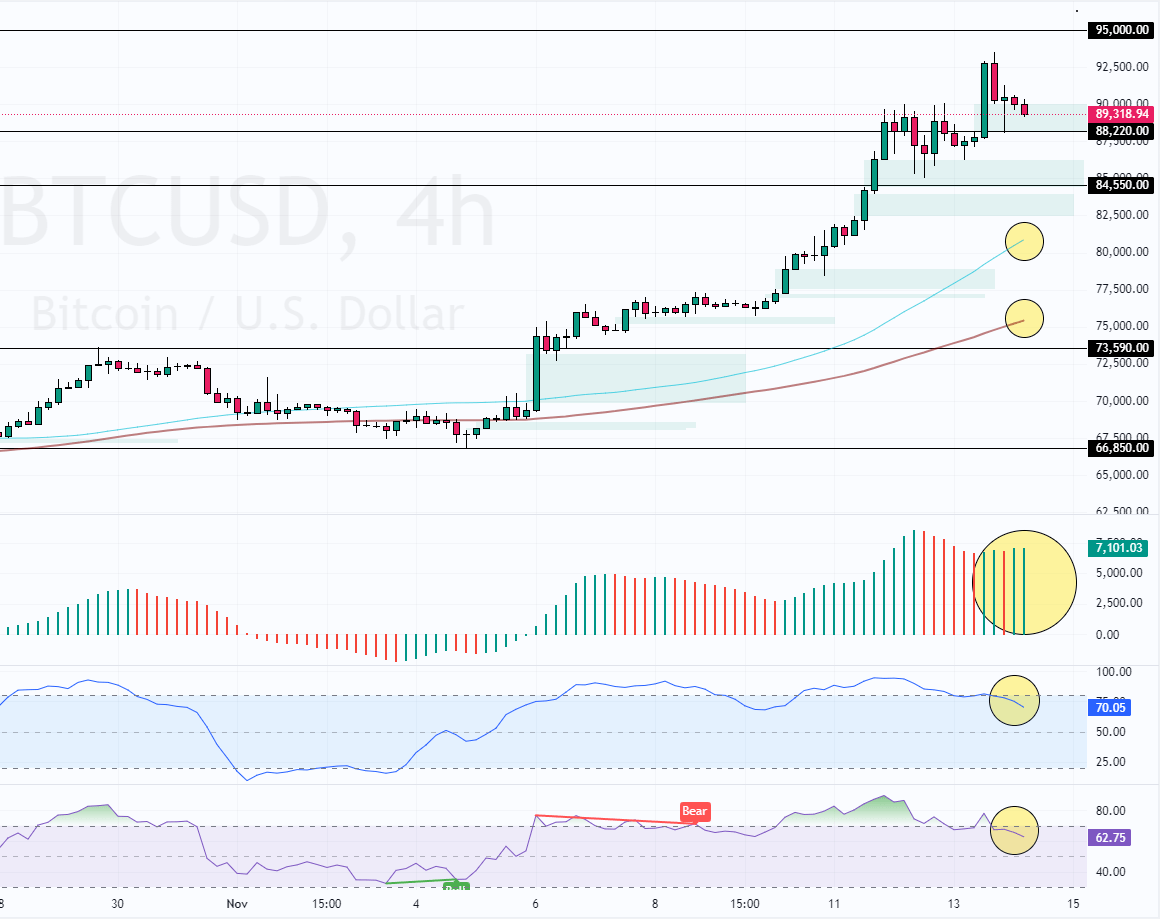
FxNews—Bitcoin trades in a strong bull market. Last day, the uptrend eased, and BTC tested the $88,220 bullish Fair Value Gap as active immediate resistance. Consequently, the 4-hour chart formed a long wick candlestick pattern clinging to the immediate resistance.

Bitcoin Technical Analysis – 14-November-2024
As for the technical indicators, the Stochastic and RSI are cooling from an overbought signal, depicting 71 and 64 in the description, respectively. On the other hand, the Awesome Oscillator’s recent bar turned green while it was above the zero line.
These developments in the technical indicators suggest the BTC/USD price might consolidate and trade sideways before a new bullish or bearish wave begins.
https://youtu.be/4hF4eezwqNY
Bitcoin Forecast – 14-November-2024
From a technical perspective, the uptrend will likely resume if BTC/USD holds above $84,220 (immediate support). In this scenario, the next bullish target could be the 95,000 mark.
Conversely, the bullish outlook should be paused if Bitcoin falls below the 88,220 mark. If this scenario unfolds, Bitcoin will likely start a new consolidation phase that could extend to the 84,550 support.
- Support: 88,220 / 84,550
- Resistance: 95,000 / 97,000