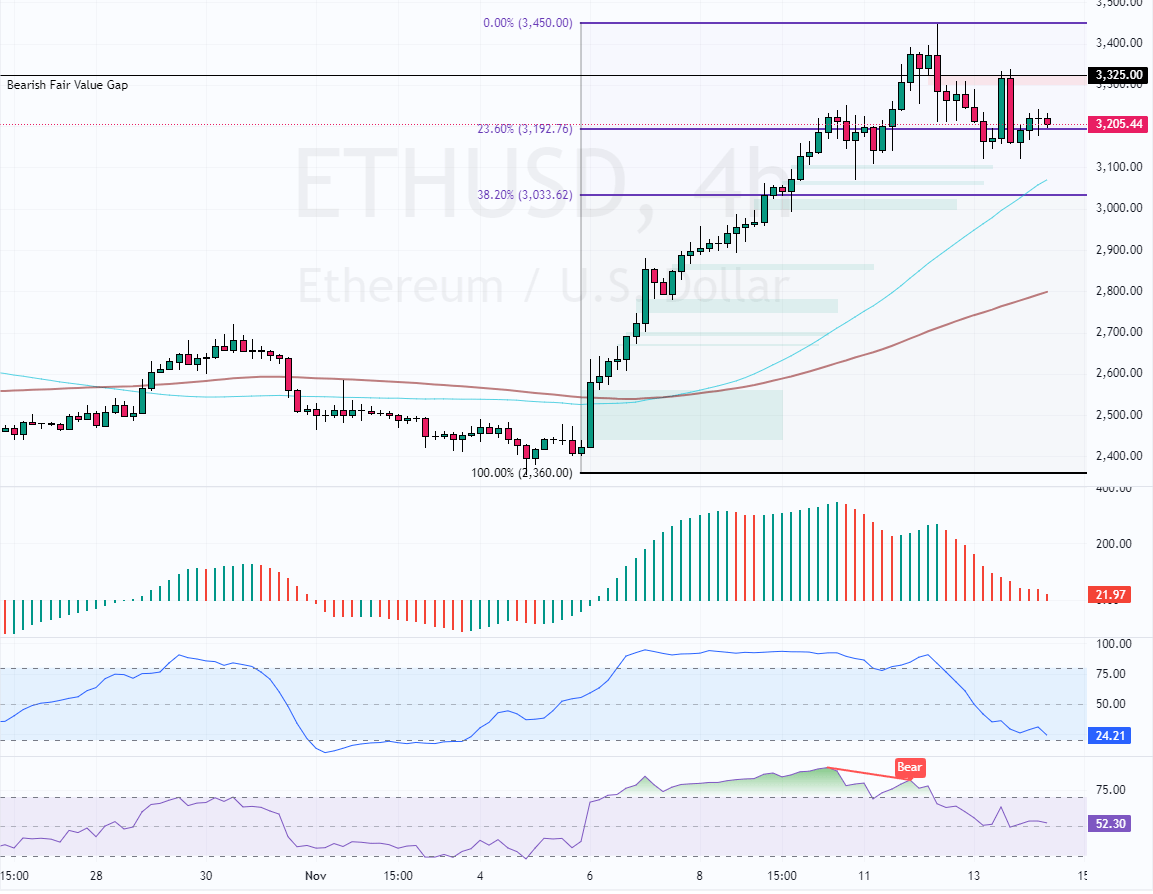
FxNews—Ethereum has been in a strong bull market since November 5. However, the bullish wave from $2,360 eased after the price surged to $3,450. Furthermore, the decline initiated on November 12 was expected because the RSI and Stochastic were hovering in overbought territory. Additionally, the RSI 14 was signaling divergence, which justifies the ETH downtick momentum.
As of this writing, Ethereum trades at approximately $3,200, slightly above the 23.6% Fibonacci retracement level.

Ethereum Technical Analysis – 14-November-2024
Ethereum’s primary trend should be considered bullish because the prices are above the 50-period simple moving average. However, the Awesome Oscillator histogram is red, nearing the signal line from above, meaning the bear market is strengthening.
Furthermore, the RSI indicators depict 52 in the description, suggesting a sideways and low-momentum market. Meanwhile, the Stochastic Oscillator record shows 24 in the description, meaning the market is not oversold but could soon be.
Overall, the technical indicators suggest while the primary trend is bullish, the prices could consolidate near the lower support levels.
Ethereum Price Forecast – 14-November-2024

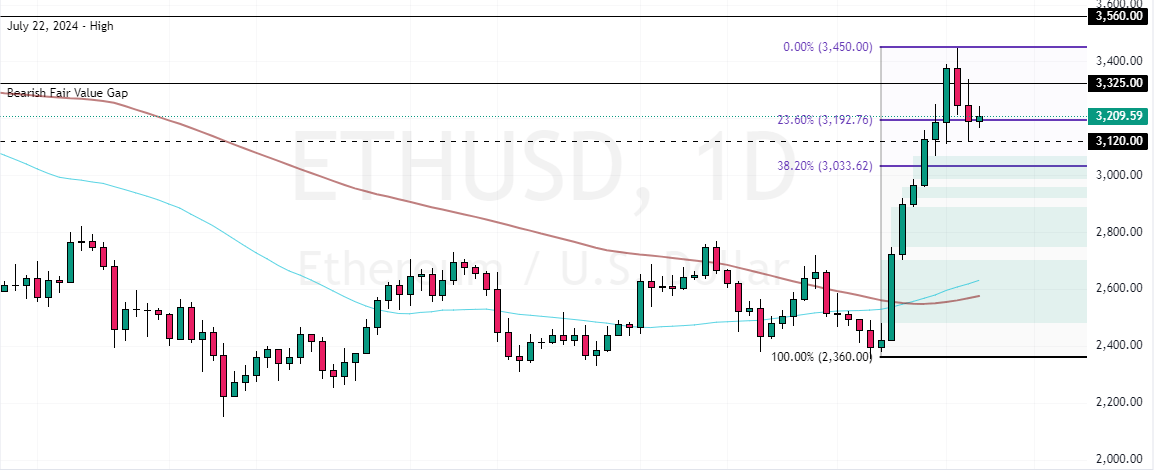
The immediate support is at $3,120, slightly below the 23.6% Fibonacci retracement level. From a technical perspective, a near bearish wave could emerge if Ethereum prices close below the immediate support. In this scenario, the next bearish target could be the 38.2% Fibonacci at $3,030, backed by the 50-period simple moving average.
- Good read: Bitcoin Eyes $95K if It Stays Above $84K
Please note that the immediate resistance rests at $3,325. The bearish outlook should be invalidated if the ETH/USD price exceeds this resistance. If this scenario unfolds, the uptrend will likely resume, and the next bullish target could be retesting the $3,450 high. Furthermore, if the buying pressure exceeds $3,450, the bulls’ path to the July 22 high at $3,560 could be paved.
- Support: 3,120 / 3,030
- Resistance: 3,325 / 3,450 / 3,560