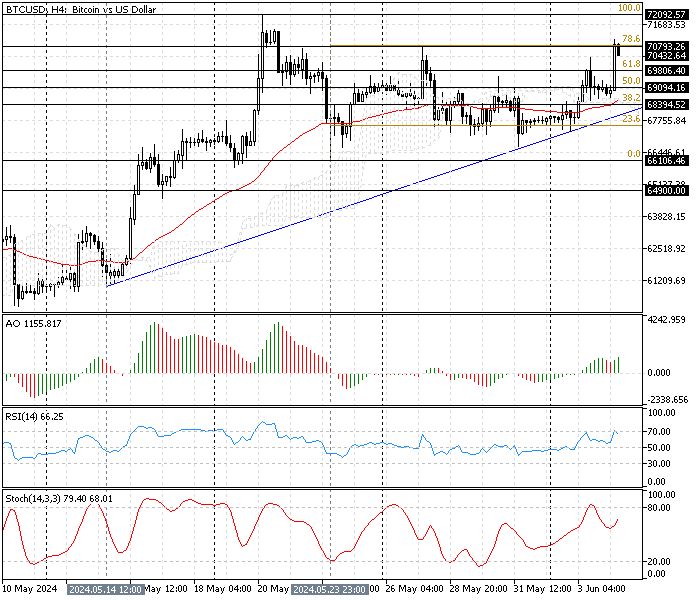
FxNews—Bitcoin broke out from the descending trendline and the 61.8% Fibonacci resistance at $69,806 in today’s trading session. The digital gold is testing the 78.6% Fibonacci at $70,830. The BTC/USD 4-hour chart below shows the Fibonacci levels and technical tools used in today’s technical analysis.

Bitcoin Technical Analysis – 4-June-2024
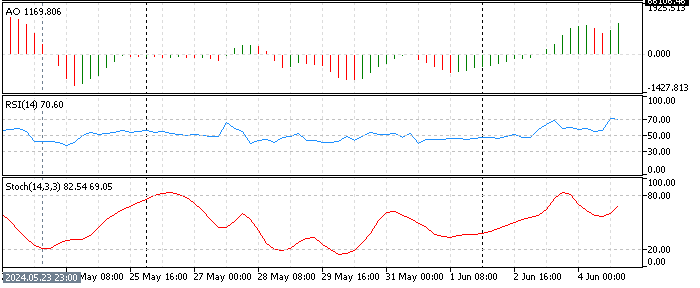
The technical indicators in the BTC/USD 4-hour chart provide the following information.

- The awesome oscillator bars are green. The value is rising; it currently depicts 1169 in the description. This means the bull market prevails.
- The relative strength index indicator clings to overbought territory. This growth in the RSI 14 means the market might become overbought soon, so the price of Bitcoin may consolidate.
- The Stochastic oscillator value is 81 and has room to become overbought, which interprets that the trading instrument has room to become overbought.
These developments in the Bitcoin 4-hour chart suggest the bull market prevails and might resume, but the price might consolidate before a new bullish wave begins.
Bitcoin Price Forecast – 4-June-2024

The immediate resistance is the 78.6% Fibonacci level at $70,830, and the critical support level is the %50 Fibonacci level at $69,115. If the Bitcoin price exceeds the immediate resistance, the next bullish target is the May 21 high at $72,092.
Please note that the bullish scenario should be invalidated if the price dips below the immediate resistance mentioned in the paragraph above.
Bearish Scenario
The ascending trendline from May 14 supports the bull market. However, the uptrend should be invalidated if the BTC/USD price declines below the 38.2% Fibonacci level at $68,394.
If this scenario unfolds, the next critical support will be the May 23 low at $66,106.
Bitcoin Key Support and Resistance Levels
Traders and investors should closely monitor the key levels below to make informed decisions and adjust their strategies accordingly as market conditions shift.
- Support: $69,800 / $69,090 / $68,390
- Resistance: $70,793 / $72,090