Thursday, November 21, 2024
1.4 C
London

Bitcoin Technical Analysis – January-29-2024

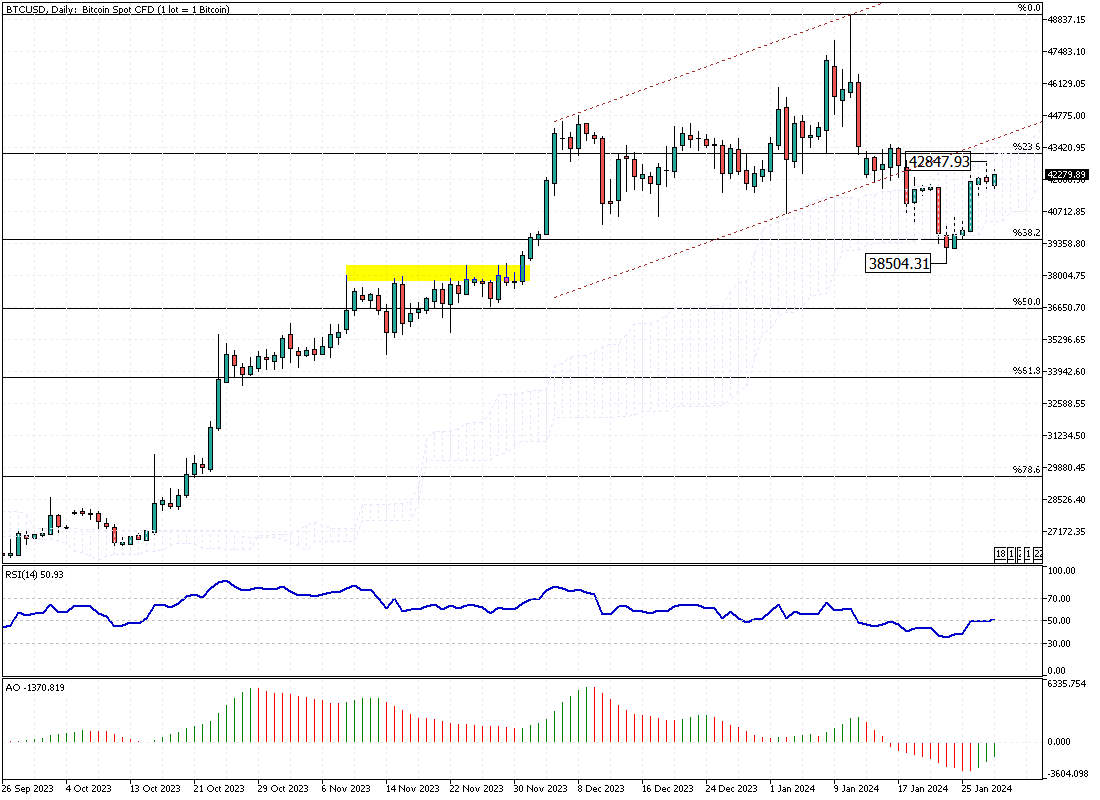
Bitcoin‘s price bounced from the $38,504 mark, which coincides with the mid-November high. The price of digital gold is hovering around $42,300 at the time of writing.
Bitcoin Technical Analysis - January-29-2024
Bitcoin Technical Analysis – January-29-2024 | Daily Chart

While the technical indicators promise a continuation of the trend, a long wick candlestick pattern is formed in BTCUSD’s daily chart, with the highest price point at $42,847. As a result, the daily chart suggests the possibility of a correction phase, and the Ichimoku cloud backs up this idea.

However, we should zoom in on the 4-hour chart to gain better insight.

Bitcoin Technical Analysis: Correction Phase in Horizon
Bitcoin Technical Analysis - January-29-2024
Bitcoin Technical Analysis – January-29-2024 | 4-Hour Chart

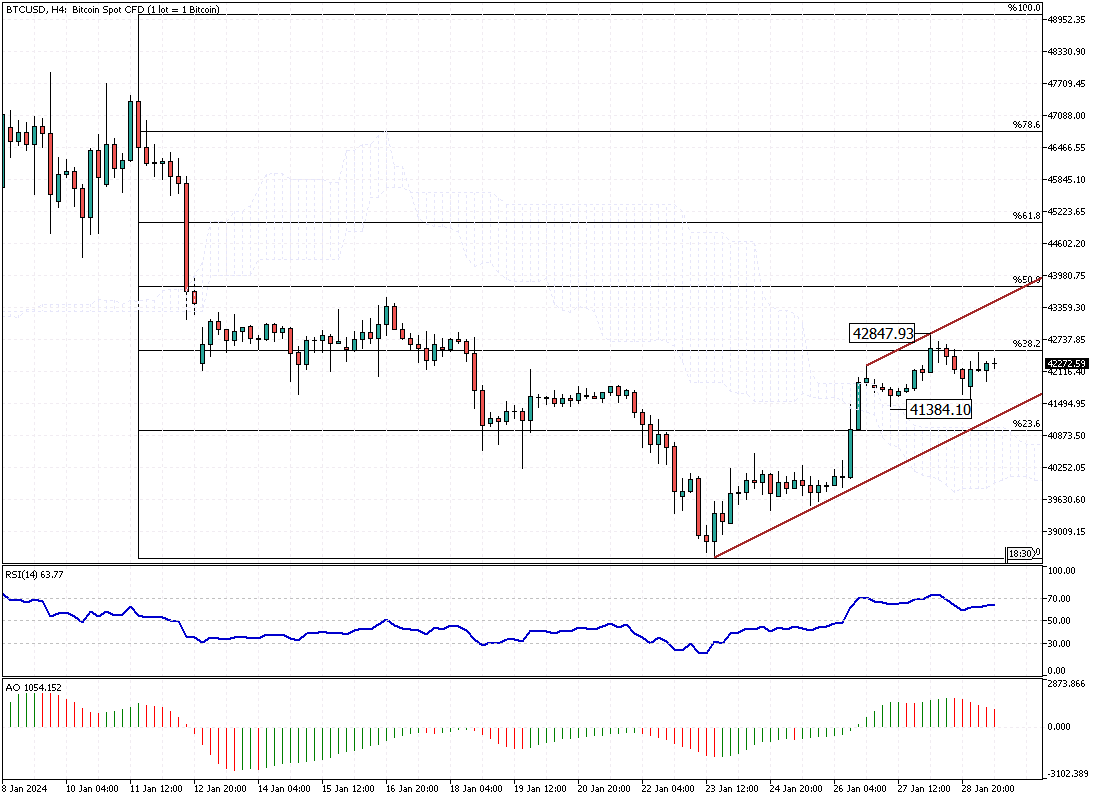
The BTCUSD pair successfully flipped above the Ichimoku cloud, which can be interpreted as a shift in trend from bearish to bullish. The RSI indicator is approaching the overbought area, and the awesome oscillator‘s bars are red.

Considering the Bitcoin price action and candlestick pattern in the daily chart, the trend might range between last day’s high, $42,847, and the lower band of the bullish flag, the $41,384 mark. If the price can maintain its position inside the bullish flag, the next bullish target could be the %50 level of Fibonacci resistance.

Conversely, the bullish scenario is canceled if the price exceeds 23.6% of the Fibonacci resistance. In this case, the $42,847 will be the near-higher low, and the bearish bias that began on January 11 is likely to expand, initially targeting the January 2024 all-time low, the $38,504 mark.

Latest Posts

EURJPY Drops from 165 as STOXX 50 Falls

The European stock markets experienced declines. The STOXX 50...

Crude Oil Prices Test $69.5 Amid Escalating Global Tensions

WTI crude oil futures rose to approximately $69.5 per...

USDCHF Rises Amid Unexpected Drop in Swiss Inflation

The USD/CHF pair bounced from the %50 Fibonacci retracement...

Iron Ore Prices Surge to $102 Amid China Demand

Iron ore prices for cargoes containing 62% iron have...

November Boost in France Manufacturing Climate

In November 2024, France's manufacturing climate indicator rose to...

Crude Oil Prices Test $69.5 Amid Escalating Global Tensions

WTI crude oil futures rose to approximately $69.5 per...

Gold Surges Above $2650 as Russia-Ukraine War Escalates

Gold prices exceeded the 38.2% Fibonacci level, trading at...

Gas Prices Near Year High as Cold Snap Threatens Europe

Prices for European natural gas futures approached €47 per...

U.S. Gasoline Futures Hit Two-Week High at $2.05

Gasoline futures in the U.S. peaked at $2.05 per...

Silver Rally Halts at $31.4 Amid Solar Panel Surplus

FxNews—Silver prices eased to $30 per ounce as the...

Oil Prices Stable $69 as Geopolitical Risks Soar

FxNews—WTI crude oil futures remained above the $66.8 critical...

WTI Crude Dips to $68.5 as Norway Field Restarts

On Tuesday, WTI crude oil futures decreased to $68.5...

Silver Eyes $31.3 Amid Changing Fed Policy Views

FxNews—Silver prices test the $31.3 resistance, above the 50-period...
spot_imgspot_img