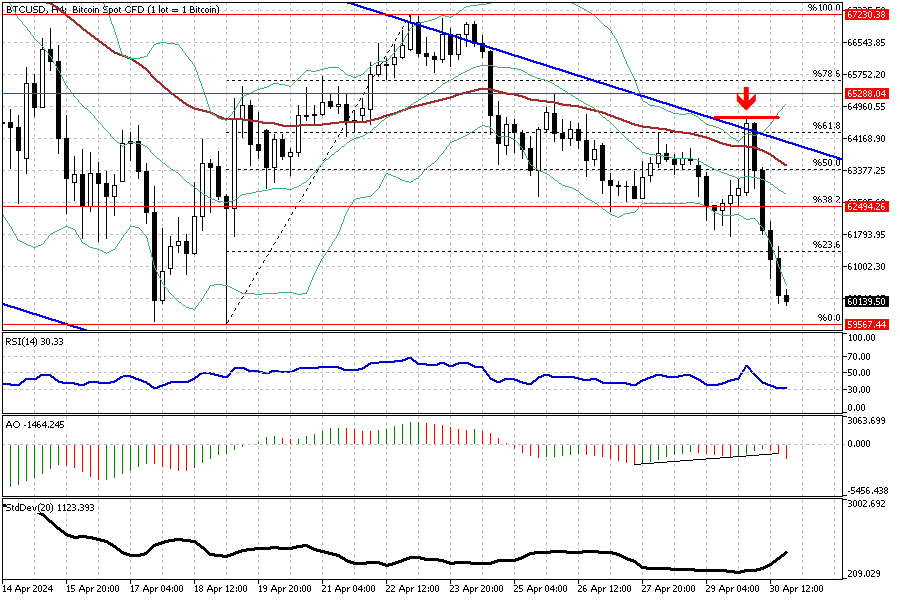
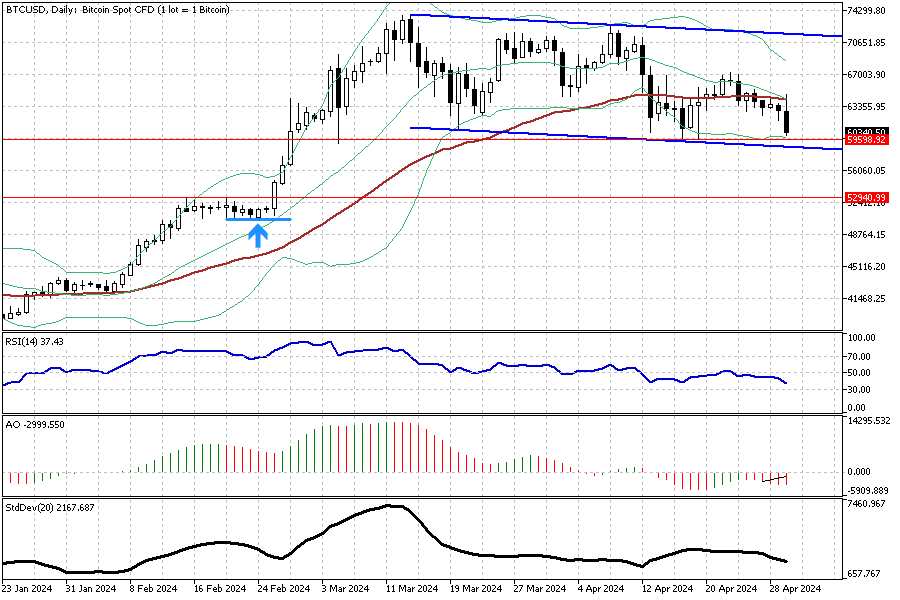
FxNews–The bitcoin price again reacted negatively to the upper band of the bearish flag. In today’s trading session, the new wave extended down to the $60,000 resistance, and as of this writing, the BTCUSD trades at about $60,280.

Regarding the technical indicators, the RSI is nearing the oversold zone but hasn’t stepped below 30 yet. This behavior from the relative strength index can be interpreted as the market has more room to decline. Therefore, the price might drop to April’s low, at $59,500.
Interestingly, while the RSI signals more decline, the awesome oscillator alerts divergence, which could lead the market into a consolidation phase or a possible reversal. This AO’s signal is supported by the Bollinger bands, where the price of the digital gold crossed the lower line, which is a signal for an oversold market.
Bitcoin Potential Pullback Levels
Based on the data we receive from the BTCUSD 4-hour chart and the technical indicator, the downtrend will likely continue to April’s lowest point, $59,500. The bearish trend might rest at this point, and the market might witness a pullback to the 23.6% Fibonacci level, followed by the 38.2% level, or the $62,490 mark.
Impact of Breaching April’s Low on Bitcoin Prices

It is worth noting that April’s low coincides with the lower band of the bearish flag (the blue line), as depicted in the daily chart. Should this level be breached, Bitcoin will likely experience more decline. In this case, the next support will be the $52,940 mark.
Defining Market Shifts at $65,288
The EMA 50, the upper band of the flag, and the $65,288 mark play the pivot between the bear and the bull market. The bearish technical analysis should be invalidated if the bulls push and stabilize the price above this level. In a bull market scenario, the rise will likely aim for the April 24 high, the $67,230 mark.