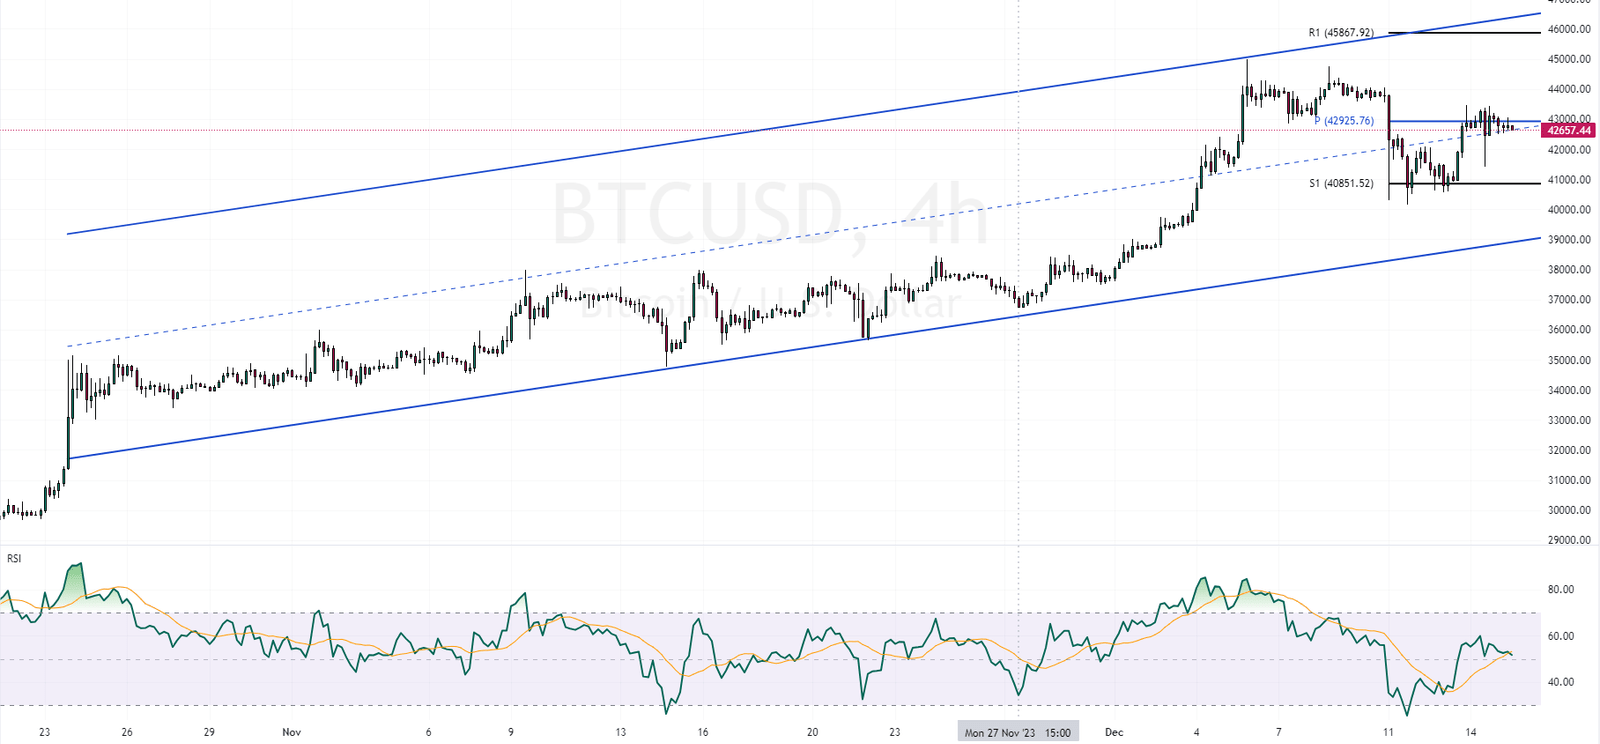
Bitcoin is currently positioned near the central line of its bullish flag pattern. This median line plays a crucial role in determining its next move.
According to the BTCUSD 4-hour chart, the weekly pivot point is $45,925. Meanwhile, the RSI (Relative Strength Index) isn’t offering a clear direction. It’s fluctuating around the midline, leaving the market’s next trend somewhat uncertain.

Bitcoin Bullish Scenario
Should Bitcoin maintain its position above the pivot point, the upward trend will likely persist. In this case, the next target for bullish traders would be the R1 resistance level, situated near $45,867.
The Bearish Scenario
Conversely, if Bitcoin falls below the pivot, which seems plausible given the current candlestick patterns, it could signal a bearish turn. The next target in such a scenario would be the S1 support level, around $40,851.