Reuters—At the start of this week, the crude oil market analysis showed that the oil price had returned. This was a crucial move as it helped stabilize a situation where oil was sold too quickly. However, this might draw in more people looking to sell their oil.
For the last six trading sessions since September 28, the oil price has dropped by 12.8%. The lowest price was noted right after some job-related data was released. But then, there was a shift in the market as people started buying oil again. They believed that even with a robust job market in the US, inflation isn’t rising. On Monday, there were concerns that the energy supply might be cut short due to conflicts involving Muslim countries, which could impact oil and gas supplies.
Crude Oil Market Analysis
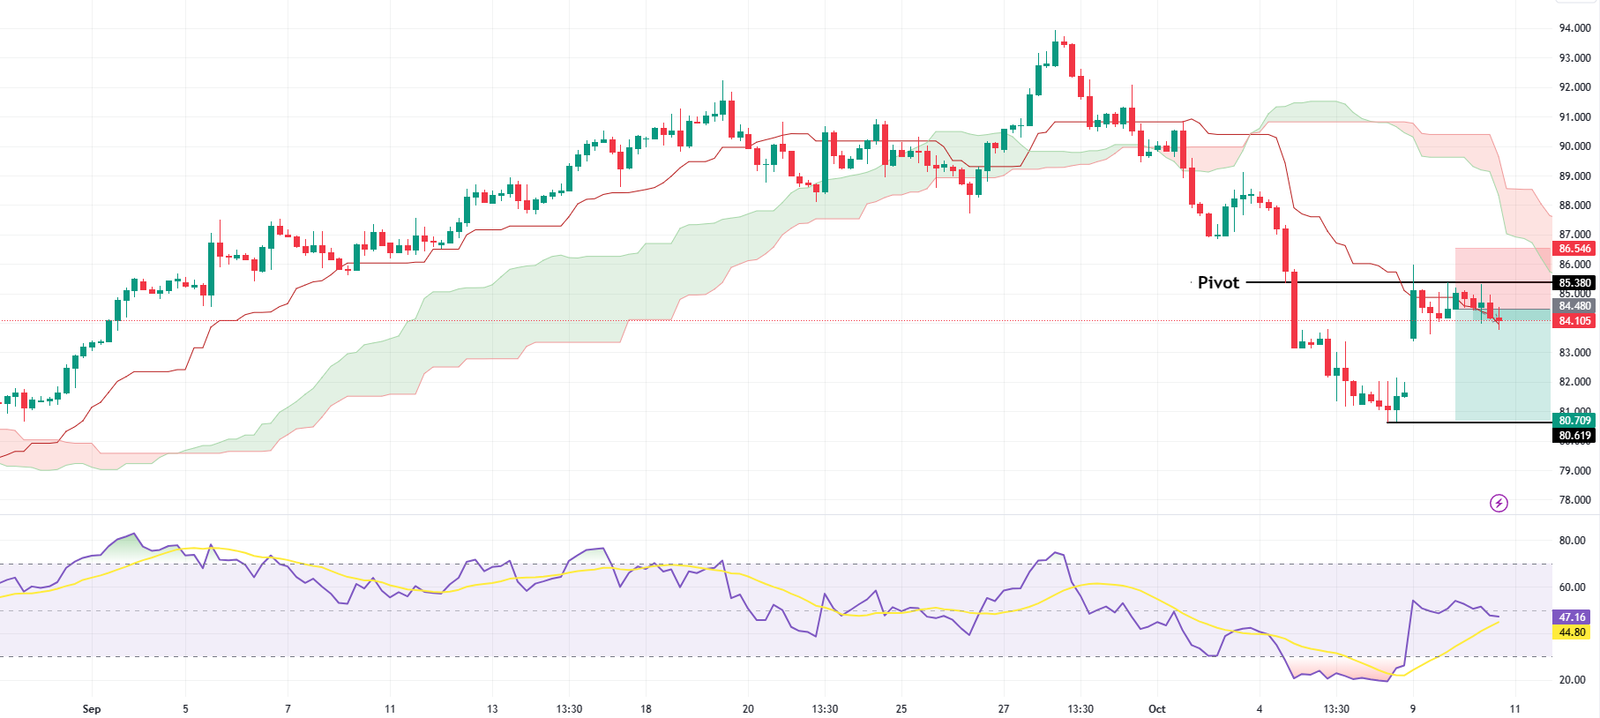
In our comprehensive Crude Oil Analysis, we delve into the intricate details of the oil market. Despite attempts, the WTI could not secure a close above the 85.38 pivot during today’s trading session. This observation is a crucial part of our analysis. To dissect the Crude Oil Market in-depth, we employ essential tools such as the Ichimoku cloud, pivot indicator, and the RSI on the chart. These tools give us a detailed perspective on the market trends and potential shifts.
According to our Crude Oil market analysis based on the 4H chart, the trend appears bearish. This is evident as it hovers below the Ichimoku cloud and the pivot line. The RSI indicator flipping below the 50 level further strengthens this bearish scenario.

We also identified an inverted hammer candlestick pattern supporting our bearish outlook. Therefore, if the oil price continues to hold below 85.38, bears could push the price to lower support levels. The first target would be the recent low, around $80. The risk/reward ratio for this trade stands at 1.8.
However, our crude Oil market analysis also considers potential bullish scenarios. The Ichimoku cloud is crucial in providing a bullish outlook for our analysis. This would only occur if the price breaks above the upper bands of the cloud, referred to as leading Span B or Sendou Span B.