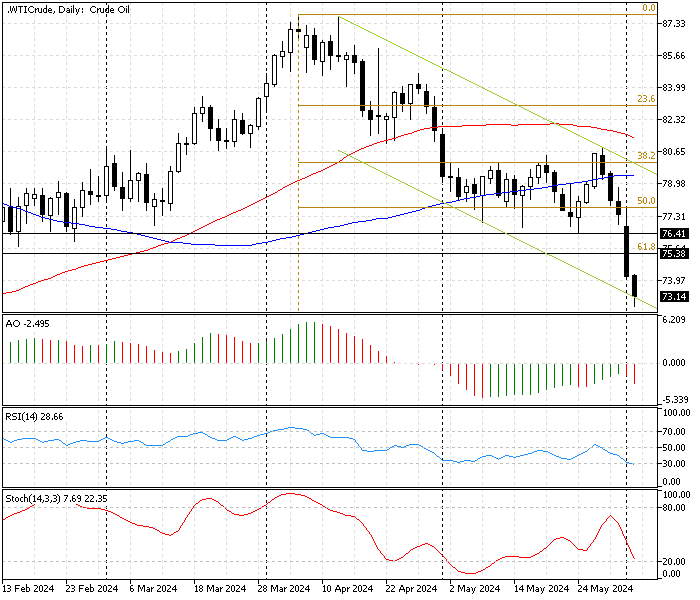
Crude oil decline accelerated after the bears pushed the price below the critical resistance at $76.4. The WTI Crude Oil trades at about $73 against the U.S. Dollar, below the 61.8% Fibonacci.
The WTI Crude Oil 4-Hour chart below shows the pair trading in the bearish flag, testing the lower line. Furthermore, the positions of the Fibonacci level, technical indicators, and moving averages are visible.

Crude Oil Technical Analysis – 4-June-2024

The technical indicators suggest the downtrend will likely ease, and the bearish momentum will likely lose its velocity soon as it nears the next resistance level at the 78.6% Fibonacci, the $71.9 mark.
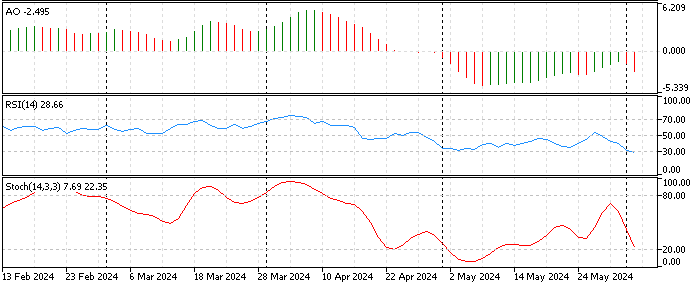
- The awesome oscillator bars are red, below the zero line, depicting -2.4 in the description. This decline in the AO bars is interpreted as the downtrend prevailing.
- The relative strength index (RSI) is crossing into oversold territory. Currently, the value of RSI (14) is 28, below zero, which indicates that the Oil market is oversold and that a correction cycle could be on the horizon.
- The Stochastic oscillator approaches oversold territory with a sharp decline in the %K line, with the current value floating around 22, slightly above the 20 line. This means the oil market will soon become oversold, and consequently, the oil price might correct some of its recent losses.
Crude Oil Price Forecast – 4-June-2024
The technical indicators warn traders and investors of an oversold market. Therefore, going short and joining the bear market with the current circumstances is not recommended because the oil price is flooded with selling pressure. That said, we advise waiting for the Oil price to start the consolidation phase near the immediate resistance at $75.38, the 61.8% Fibonacci retracement level.
Also, traders and investors should closely monitor the immediate resistance at $75.38 and the key resistance level at $76.4 for a bearish candlestick pattern, such as bearish engulfing, a long wick candlestick pattern, before deciding to join the bear market.
Please note: If the Oil price rises above the key resistance at $76.4, the bearish outlook should be invalidated.
- Next read: Crude Oil Technical Analysis – 6-June-2024
WTI Crude Oil Key Support and Resistance Levels
Traders and investors should closely monitor the key levels below to make informed decisions and adjust their strategies accordingly as market conditions shift.
- Support: $71.9
- Resistance: $76.51 / $77.76 / $80.1