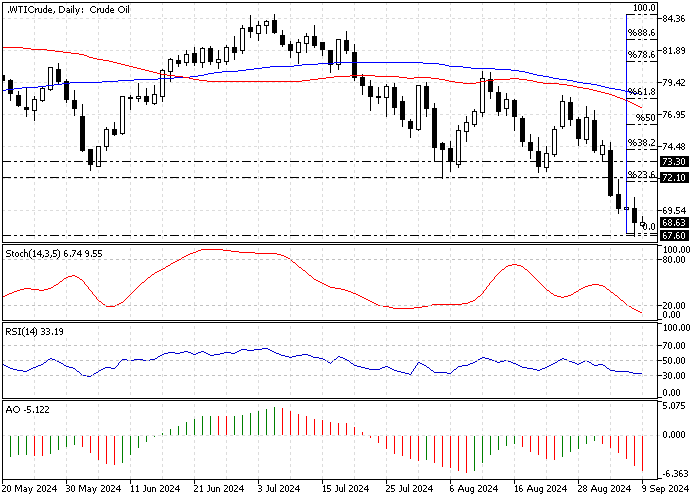
FxNews—WTI Crude Oil is in a robust downtrend. On Friday, it tested the December 2023 low at $67.6. The intense selling pressure has driven the stochastic oscillator into oversold territory on the daily chart.
The image below demonstrates the Oil price, key Fibonacci levels, and indicators used in today’s technical analysis.

Crude Oil Technical Analysis – 9-September-2024

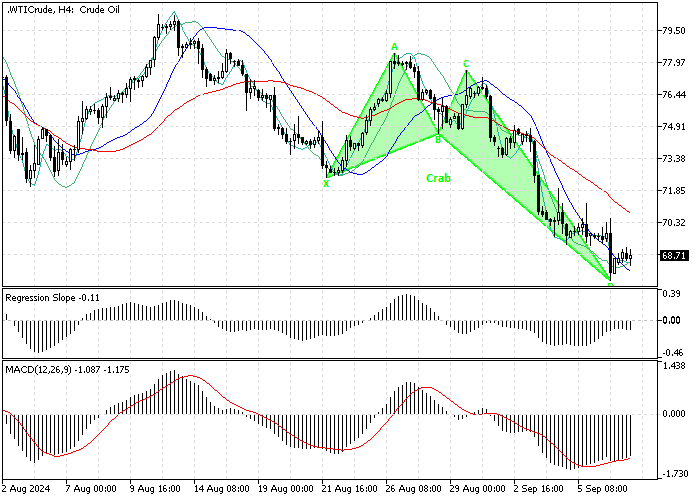
Zooming into the 4-hour chart, we notice the bears broke below the bearish flag, and the downtrend cooled near the critical resistance level at $67.6.
- The stochastic oscillator stepped outside the oversold area, depicting 30 in the value, meaning the uptrend is gaining momentum.
- The relative strength index, or RSI 14, aligns with the stochastic oscillator. The indicator shifted above the 30 level, signifying that the bearish trend is weakening.
- The awesome oscillator bars are below the signal line, but the recent bar turned green, meaning the primary trend is bearish. Oil can potentially erase some losses by consolidating to the upper resistance levels.

As for the harmonic pattern, the 4-hour chart formed a bullish crab pattern, indicating a potential trend reversal.
Overall, the technical indicators and the harmonic pattern suggest the primary trend is bearish, but the price could rise or consolidate.
Crude Oil Forecast – 9-September-2024
The critical resistance level rests at the December 2023 low, $67.6. As mentioned at the beginning of this article, the market is oversold.
Hence, from a technical perspective, if the Bulls hold above the $67.6 resistance, the price could rise, and the $72.1 (August 05 Low) could be tested. Furthermore, if the buying pressure exceeds $72.1, the next resistance level will be $73.3 (September 02 Low).
Please note that a dip below $67.6 will invalidate the bullish scenario.
- Also read: Solana Technical Analysis – 7-September-2024
Crude Oil Bearish Scenario – 9-September-2024
If the bears push the Oil price below the $67.6 resistance, the downtrend will likely resume. The next bearish target is the $64.1 mark, the 2023 all-time low.
Crude Oil Support and Resistance Level – 9-September-2024
Traders and investors should closely monitor the key levels below to make informed decisions and adjust their strategies accordingly as market conditions shift.
- Support: $64.1 / $67.6
- Resistance: $72.1 / $73.3