Thursday, October 24, 2024
14.3 C
London

Ethereum Analysis – RSI Divergence Indicates Trend Shift

This Ethereum analysis aims better to understand the current market dynamics and potential future movements.

Ethereum Analysis – RSI Divergence Indicates Trend Shift

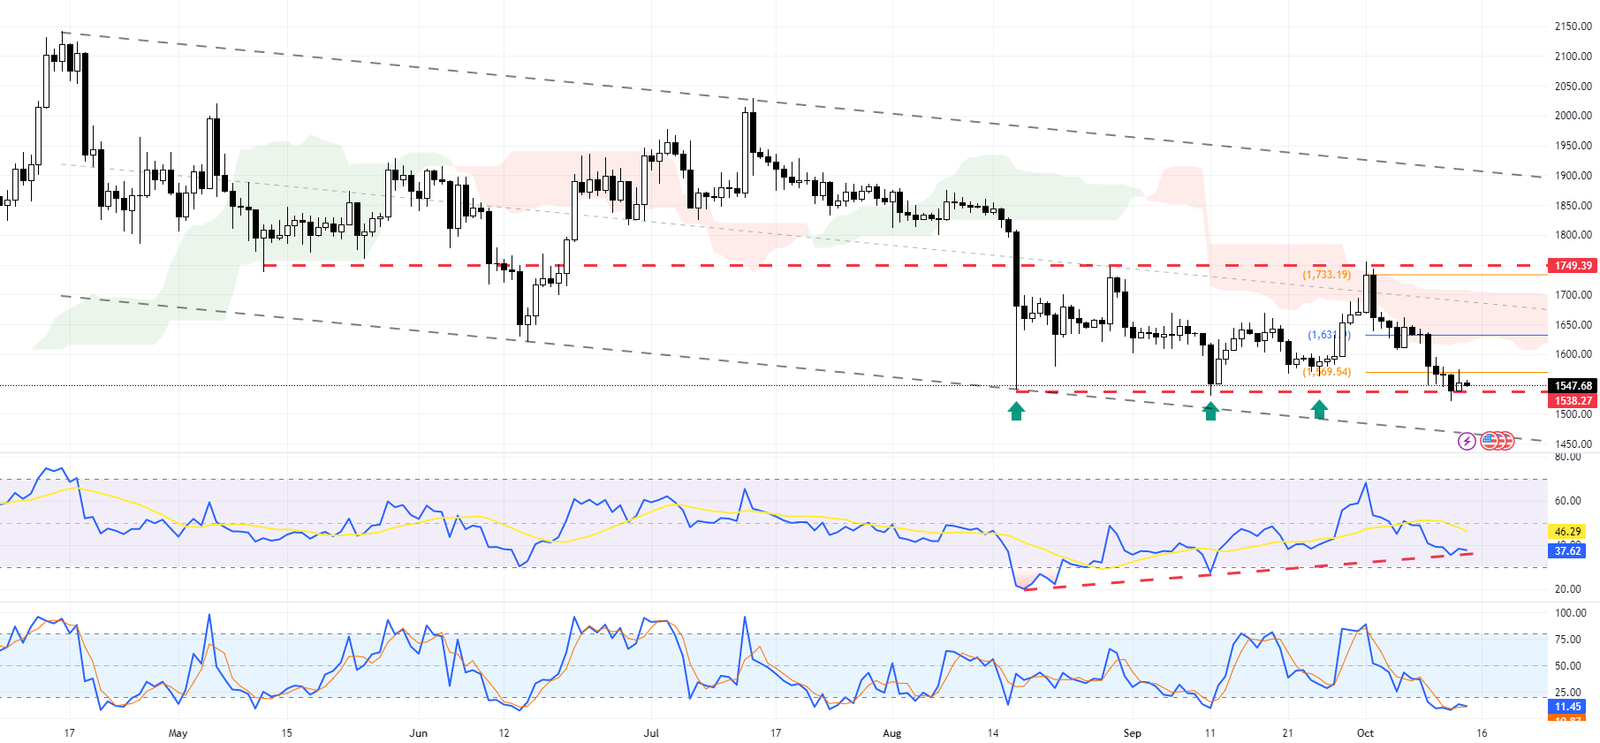
FxNews – Ethereum, the second-largest cryptocurrency by market capitalization, is currently undergoing a critical test of its $1,538 support level on the daily chart.

In recent weeks, Ethereum prices have bounced off this crucial supply area twice, indicating strong buying interest at this level. The Stochastic oscillator, a momentum indicator, has entered the oversold territory, suggesting that selling pressure may wane. Additionally, the Relative Strength Index (RSI) displays bullish divergence with the price action, signaling a potential reversal in the currency pair.
Ethereum Analysis - RSI Divergence Indicates Trend Shift
Ethereum Analysis – RSI Divergence Indicates Trend Shift

Suppose Ethereum can maintain its price above the $1,538 support level, with the RSI indicating divergence and the Stochastic oscillator signaling that ETHUSD has been oversold. In that case, we can anticipate a potential increase in value for this cryptocurrency pair in the upcoming trading sessions. At the very least, ETHUSD bulls may attempt to test the $1,631 pivot point before further decline occurs.

Ethereum Analysis - RSI Divergence Indicates Trend Shift
Ethereum Analysis – RSI Divergence Indicates Trend Shift – 4H Chart.

Examining the 4-hour (4H) chart, we observe a bullish, engulfing candlestick pattern, a positive sign for Ethereum’s price action. For this bullish scenario to be validated, it is advisable to wait for the bulls to close above the broken support at $1,579. With this confirmation, our expectations for a rise in Ethereum’s price will be reinforced, and the first target will be the pivot point at $1,631, followed by $1,715.

Conversely, if the bears close below the $1,538 support level, Ethereum’s price decline may continue, rendering the bullish signals mentioned above invalid for the time being.

Ethereum Technical Analysis: Final Thoughts

In conclusion, this Ethereum analysis highlights the importance of key support and resistance levels in determining future price movements. Traders and investors should closely monitor these levels and other technical indicators to make informed decisions in this dynamic market.

Latest Analysis

GBPJPY Holds Near 196 as FTSE Gains 0.2%

FxNews—The FTSE 100 index increased by 0.2% on Thursday,...

Solana Eyes $194 Despite Overbought Signals

FxNews—Solana is in a bull market. It surpassed the...

Cardano Downtrend Eases as Gartley Pattern Signals Buy

FxNews—Cardano dipped from its October 21 high of $0.372....

Litecoin Eyes $71.5 as Bullish Trend Gains Strength

FxNews—Litecoin bounced off the $67.5 resistance, backed by the...

Silver Reacts to FVG at $34.3 as Fed Rejects Rate Cuts

FxNews—Silver held steady around $34 per ounce on Thursday,...

Forex News

More Czechs Say Now is Not a Good Time to Buy

FxNews—In October 2024, the consumer confidence index in the...

STOXX Rises as Corporate Earnings Boost Markets

FxNews—On Thursday, the STOXX 50 rose by 0.4%, while...

French Manufacturing Sees 21st Month of Decline

FxNews—In October 2024, the S&P Global France Manufacturing PMI...

UK Borrowing Rises to £16.6B in September 2024

FxNews—In September 2024, the UK's government borrowing, not counting...

Geopolitical Tensions Drag Down European Indices

FxNews—On Monday, European stock indexes saw declines. The Stoxx...

DAX Index Falls 0.9% Amid Earnings Anticipation

FxNews—The DAX index dropped by 0.9% to 19,480 this...

US Stocks Up – Led by Netflix and Apple Gains

FxNews—U.S. stocks saw an uptick during midday trading, primarily...

European Markets Rally on ECB Cuts and China’s Support

FxNews—European markets ended the day significantly up on Friday,...
spot_imgspot_img