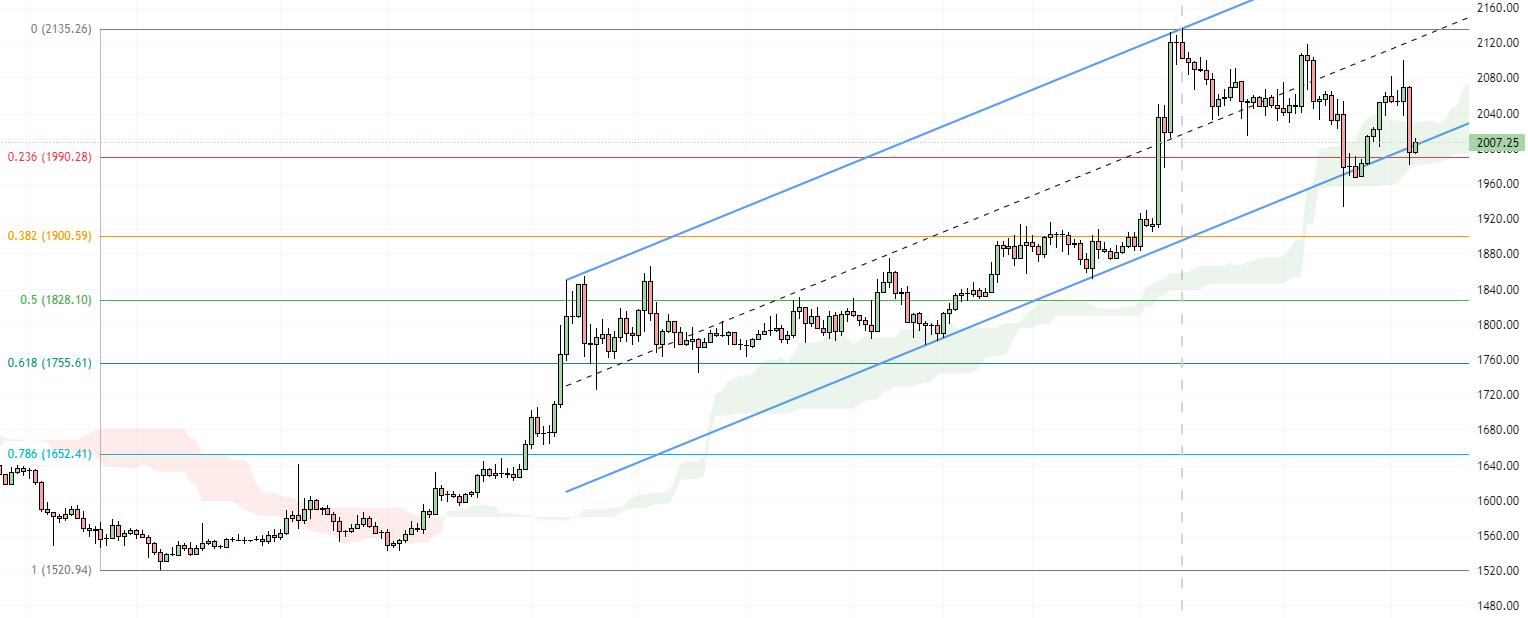
Ethereum is currently challenging the lower boundary of its bullish flag, which is evident from a lengthy bearish candlestick. The Ichimoku cloud and the 23.6% Fibonacci retracement level further reinforce this resistance. The ETHUSD trend maintains a bullish outlook as long as the pair stays above the cloud in its pairing with the U.S. dollar.
Ethereum Technical Analysis: Bearish or Bullish

However, if Ethereum settles below the cloud, the correction that began on November 10th could deepen. In this scenario, the Ethereum price might reach the 38.2% Fibonacci retracement level, potentially even extending to the 50% mark.