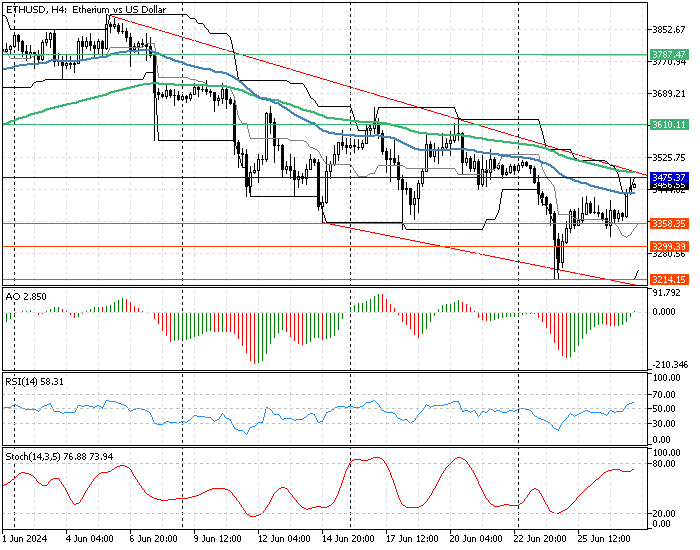
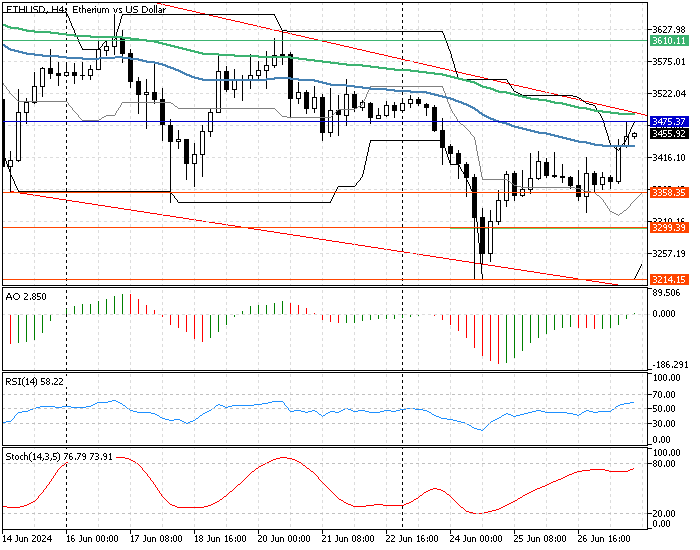
FxNews—Ethereum has been in a bear market from the $3,975 mark against the U.S. dollar since April 27. As of writing, the crypto pair trades at about $3,450, testing the weekly pivot point. The ETH/USD 4-hour chart below demonstrates that the instrument in discussion is in a bearish flag, testing the pivot point.

ETHUSD Technical Analysis – 27-June-2024
The primary trend is bearish because the Ethereum price is below the 100-period simple moving average. However, as explained below, other key technical indicators suggest the bullish trend is gaining strength and might prevail.

- Awesome oscillator bars are green and rising, approaching the signal line, depicting -14 in the description. This development in the AO bars means the uptrend is becoming stronger.
- The relative strength index (RSI 14) is above the 50 line, recording 57 in the description. This indicates that the ETH/USD price is not overbought and that the uptrend momentum could extend further.
- The stochastic oscillator is nearing the 80 level, and the %K period value is hovering around 73, suggesting the market might become overbought soon.
- The Donchian channel gives an interesting signal. In the 4-hour chart, a candle closes above the upper band, which means Ethereum could be overpriced, and the price might dip.
Ethereum Price Forecast – 27-June-2024

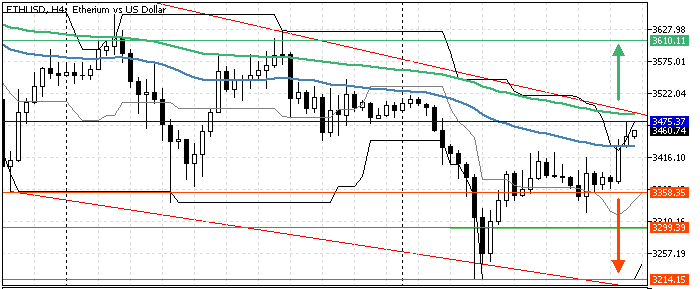
The primary trend is bearish, with immediate resistance at the pivot point of $3,475. Bulls (buyers) should close and stabilize the ETH/USD rate above the pivot for the bullish trend to resume. If this scenario unfolds, the next bullish target could be the next resistance level at $3,610, the mid-June high. Furthermore, if the buying pressure exceeds the $3,610 resistance, the next barrier will be the $3,787.
Please note that immediate support is the middle line of the Donchian channel at $3,358. If the price dips below this level, the bullish scenario should also be invalidated.
Bearish Scenario
The immediate support is at $3,358, the middle line of the Donchian channel. If the bears (sellers) close the ETH/USD price below this support in the 4-hour chart, the downtrend will likely resume, targeting $3,299 support, followed by June’s all-time low at $3,214.
The pivot at $3,475 is the key resistance for the bearish scenario. If the price exceeds the pivot, the bearish scenario should be invalidated accordingly.
Ethereum Key Support and Resistance Level – 27-June-2024
Traders and investors should closely monitor the key levels below to make informed decisions and adjust their strategies accordingly as market conditions shift.
- Support: $3,358 / $3,299 / $3,214
- Resistance: $3,475 / $3,610 / $3,787
Disclaimer: This technical analysis is for informational purposes only. Past performance is not necessarily indicative of future results. Foreign exchange trading carries significant risks and may not be suitable for all investors. Always conduct your research before making any investment decisions.