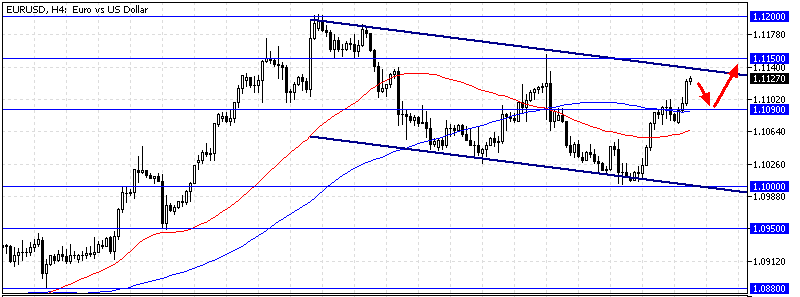
FxNews—The EUR/USD bullish wave from $1.1 is now nearing the $1.115 critical resistance in conjunction with the descending trendline. The 4-hour chart below demonstrates the price, support, resistance levels, and technical indicators used in today’s analysis.

EUR/USD Technical Analysis – 16-September-2024
Furthermore, the robust buying pressure caused the Stochastic oscillator to enter the overbought territory, signaling a saturated market. The relative strength index indicates 71 in the description, meaning the Euro is overpriced against the U.S. Dollar.
Furthermore, the EUR/USD price crossed above the 100-period simple moving average, signifying the bull market prevails, and the Awesome oscillator green histograms add credit to the bull market.
Overall, the technical indicators suggest the primary trend is bullish. The EUR/USD price can potentially rise to the upper resistance levels, but the market might consolidate before the uptrend resumes.
EUR/USD Forecast

The Stochastic overbought signal can cause the EUR/USD price to dip and test the support of $1.109 (August 22 low) before the uptrend resumes.
From a technical standpoint, the August 2024 high at $1.12 will likely be targeted if the bulls (buyers) close and stabilize the price above the immediate resistance of $1.115, the September 6 high.
Please note that the bull market remains valid if the Euro trades above the 100-period simple moving average or the $1.109 support.
EUR/USD Bearish Scenario

If the bears (sellers) close and stabilize the price below the 100-period simple moving average at $1.109, the downtrend from $1.12 will likely be triggered again.
If this scenario unfolds, the $1.1 support (September 11 Low) could be initially targeted. Furthermore, if the selling pressure exceeds $1.1, the dip can extend to $1.095.
EUR/USD Support and Resistance Levels
Traders and investors should closely monitor the key levels below to make informed decisions and adjust their strategies accordingly as market conditions shift.
- Support: $1.109 / $1.10 / $1.095
- Resistance: $1.115 / $1.12