In today’s comprehensive EURCZK forecast, we will first scrutinize the currency pair’s price action. Following that, we will meticulously delve into the fundamental analysis of the trading asset.
EURCZK Forecast: Consolidation on the Horizon
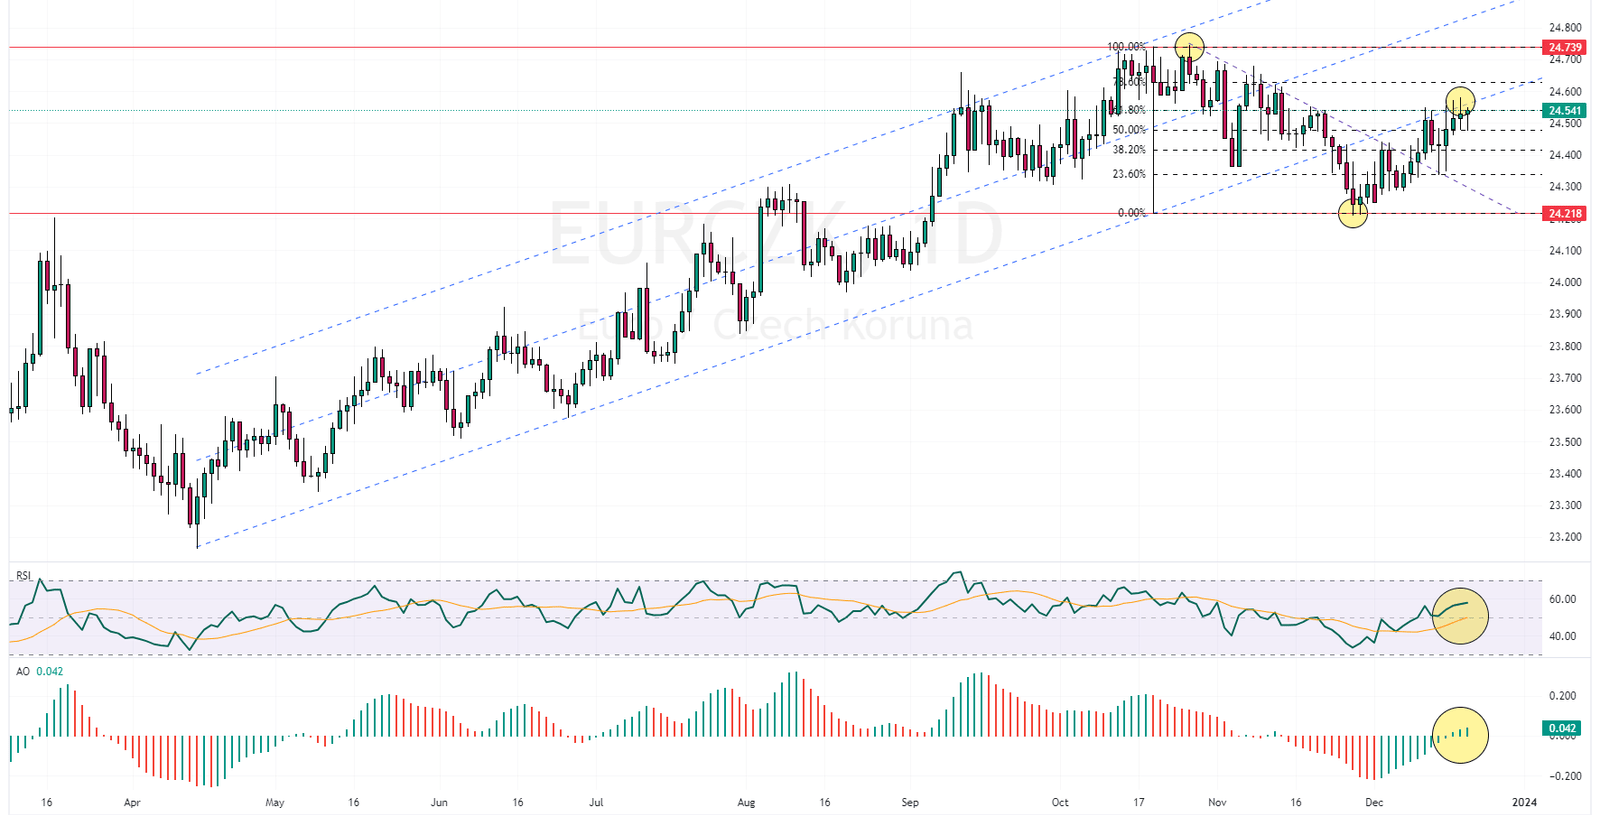
FxNews—The EURCZK chart shows that the currency pair has rebounded from the 24.21 mark, near the 38.2% Fibonacci support level. Subsequently, the bulls closed and stabilized the EURCZK price above the established bearish trend line.
The pair is approaching the lower line of the broken bullish channel. The lower band of the channel now serves as the resistance barrier. This resistance zone also aligns with the 61.8% Fibonacci resistance level.
The technical indicators appear promising for the continuation of the bullish wave. The Relative Strength Index (RSI) maintains a position above 50, indicating positive momentum. Furthermore, the Awesome Oscillator bars are green and positioned above the signal line, reinforcing bullish signals.

EURCZK Analysis: 4H Chart
Examining the lower time frame is beneficial for a deeper understanding of the EURCZK technical analysis. On the 4-hour chart, the pair is observed to be trading within a bullish flag pattern. Additionally, a bearish engulfing and a long wick candlestick is noticeable. These candlestick patterns promise a trend reversal.
These observations, combined with the divergence indicated by the Awesome Oscillator, allow us to finalize our EURCZK forecast. In conclusion, while the overall trend appears bullish, we anticipate a period of consolidation for the pair. This implies an expectation of a temporary dip in the EURCZK price. However, the market must close below the median line of the bullish flag for this decline to extend further.

Considering the currency pair’s overall trend, the lower line of the flag presents an attractive entry point for participating in the bullish market. The 50% Fibonacci retracement level further reinforces this demand level. The bullish technical analysis holds validity if the pair stays above this level.
Czech Producer Inflation Rises in November 2023
Bloomberg—In November 2023, the Czech Republic experienced a slight increase in annual producer inflation, reaching 0.8% year-on-year. This rise comes after hitting a nearly three-year low of 0.2% in October, yet it fell short of the expected 1.0% forecasted by the market. The primary driver of this inflationary uptick was the rise in electricity, gas, steam, and air-conditioning prices, which increased from 7.0% to 8.0%.
Conversely, manufacturing costs continued their downward trend, dropping by 2.5% compared to a 3.0% fall. Similarly, the inflation rate in mining and quarrying witnessed a marginal slowdown, moving from 40.2% to 39.7%, while the rate for water supply remained steady at 16.3%. On a month-by-month basis, producer prices declined by 0.4%, a deeper drop than the market’s prediction of a 0.2% decrease. This further descent follows a 0.1% fall recorded in October.