In today’s comprehensive EURJPY forecast, we will first scrutinize the currency pair’s price action. Then, we will meticulously delve into the fundamental analysis of the trading asset.
EURJPY Technical Analysis – Ichimoku Cloud and Key Levels
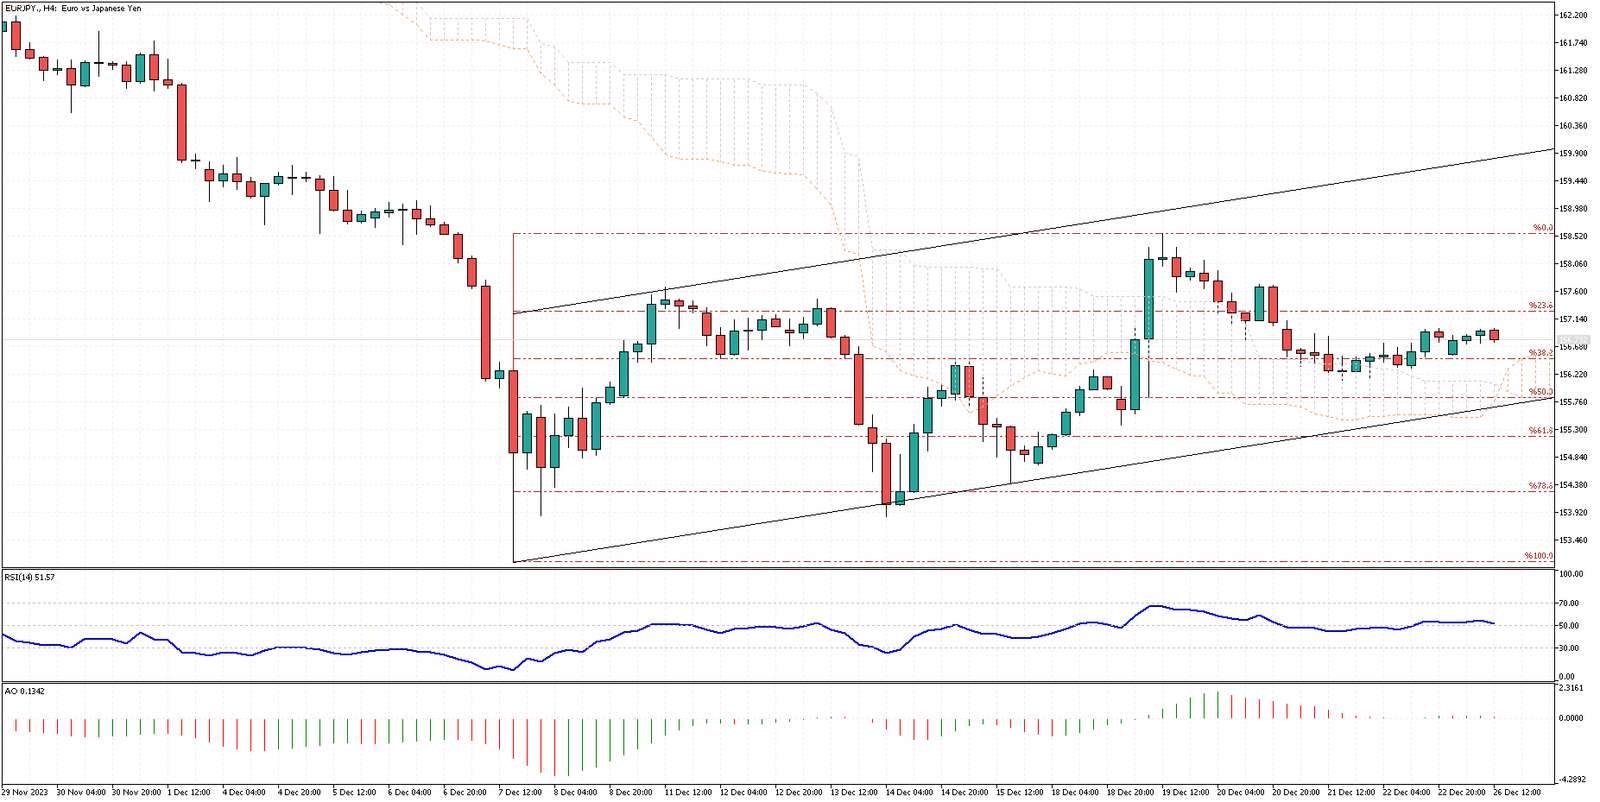
FxNews—The EURJPY currency pair is currently in a critical phase as it tests the Ichimoku cloud. This is a significant event, as the pair crossed above the cloud just last week, indicating a potential bullish trend.
The recent decline that we’re witnessing could be interpreted as a consolidation phase. This is a common occurrence in the market where, after a significant move, the price action tends to ‘rest’ before continuing its trend.

However, it’s important to note that the bullish bias should be reconsidered if the pair continues to decline and moves below the cloud. This would imply that the Ichimoku signal could be false initially, indicating a bullish trend.
From a technical analysis standpoint, as long as the pair remains within the channel and above the 50% Fibonacci support level, the short-term trend can still be considered bullish.
The Fibonacci retracement levels are widely used in technical analysis to identify potential areas of support and resistance. In this case, the 50% level strongly supports the pair. If the pair continues to hover within these parameters, the target could be the upper band of the bullish flag pattern.
- Also read: EURJPY Forecast – US Downturn Boosts Yen
Euro Hits $1.1: Rate Cuts & ECB’s Next Step.
Bloomberg—We’ve all seen the currency charts dance this year, haven’t we? And now, the euro’s doing a little victory twirl, spinning up to $1.1—its highest groove in five months. Here’s the scoop: the latest PCE inflation numbers from the US have got everyone buzzing that the Fed might loosen its grip on those interest rates next year. And get this: some are whispering about a rate cut as soon as March.
Meanwhile, traders are perched on the edge of their seats in the eurozone, eyes wide, waiting to see if the ECB will join the party and trim those borrowing costs. Could they match the Fed’s rhythm? Some say yes, but the ECB’s head honchos seem to be tapping their feet to a different beat.
If we zoom out to the big picture, the euro has quietly flexed its muscles all year. When the final bell rang, it was about 3% stronger. Not too shabby for a currency, many thought was down for the count.