In today’s comprehensive EURNZD forecast, we will first scrutinize the current economic conditions in the Euro area. Then, we will meticulously delve into the details of the EURNZD pair’s technical analysis.
Signs of Recovery in Euro PMI
Bloomberg—In November 2023, the Eurozone’s manufacturing sector displayed a small but notable improvement. The HCOB Eurozone Manufacturing Purchasing Managers’ Index (PMI) rose to 44.2, up from 43.1 in October. This increase marks the highest level seen since May. However, it’s important to recognize that despite this increase, the manufacturing sector is still facing a period of contraction – this has been the case for the past seventeen months.
The contraction in manufacturing has been uneven across the Eurozone, with some countries experiencing more significant declines than others. Austria is at the forefront of this downturn, with Germany and France also seeing notable decreases. This regional variation highlights the differing economic conditions and challenges the Eurozone faces.
Several factors have contributed to the ongoing contraction in manufacturing:
- Output: There has been a continuous decrease in production, although this decline has slowed.
- Orders and Sales: New and export orders have declined, indicating reduced demand for Eurozone manufactured goods.
- Backlogs and Employment: Work backlogs have been diminishing for a year and a half, indicating a lack of new orders. Employment in the sector is also decreasing, with job losses reaching a rate not seen since August 2020.
- Supply and Delivery: Supplier delivery times have been improving for ten months.
- Pricing: Prices for inputs and outputs are in a deflationary phase, meaning they are decreasing.
Despite these challenges, there is a silver lining. Business confidence within the sector has improved, reaching its highest in three months. This could indicate a more positive outlook for the future.
EURNZD Technical Analysis and Forecast
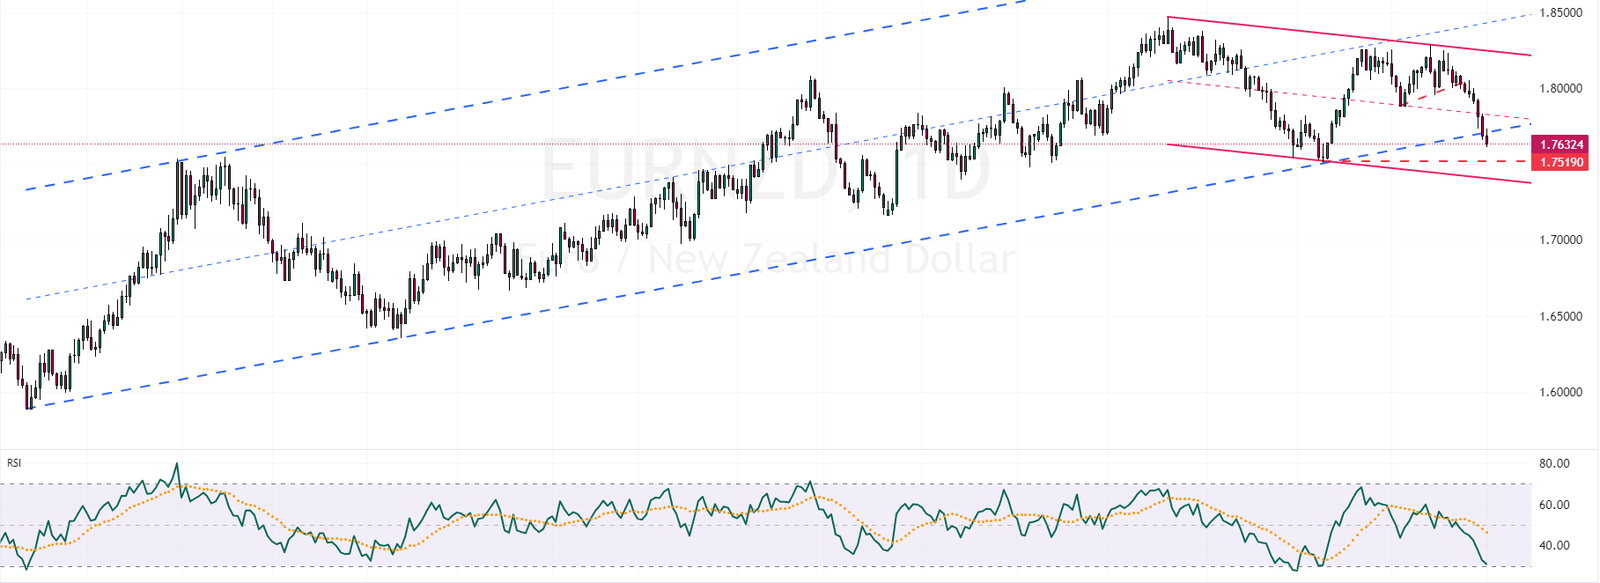
The selling pressure on the EURNZD currency pair has intensified, surpassing general expectations. Major players refrained from stepping in when the price approached the 1.771 area, escalating the downward momentum. This significant shift was confirmed once the pair broke below the lower line of the bearish flag pattern on the EURNZD daily chart.

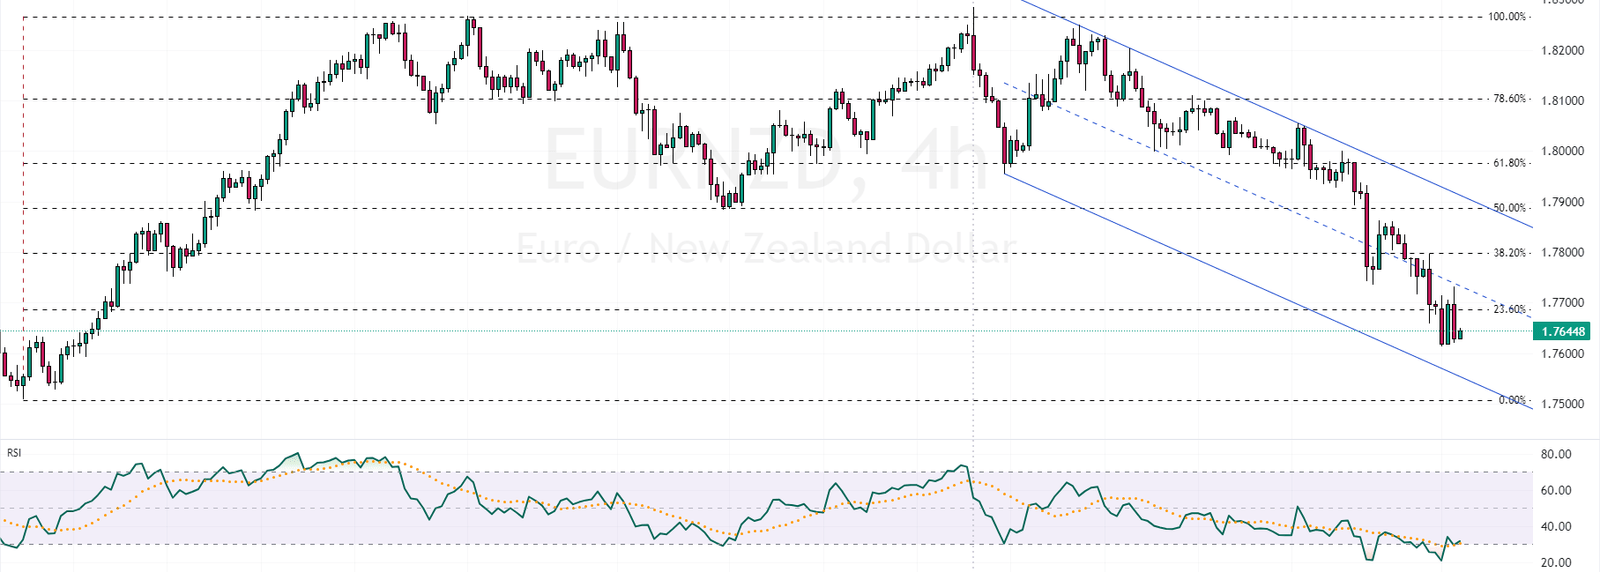
Bearish bias drives the RSI indicator towards the oversold zone. Yet, the indicator still has the potential to reach an oversold state. FxNews analysts anticipate a further decline, targeting the 1.7519 support level, followed by the lower boundary of the bearish flag. Let’s zoom in to the 4-hour chart to find when the market might exit the bullish bias.

Should the market become oversold, the EURNZD price might approach 38.2%, followed by the 50% level of the Fibonacci retracement tool. Analysts at FxNews believe that the bearish trend, which started on November 14th, will only be deemed invalid if the price breaches the 50% Fibonacci level.