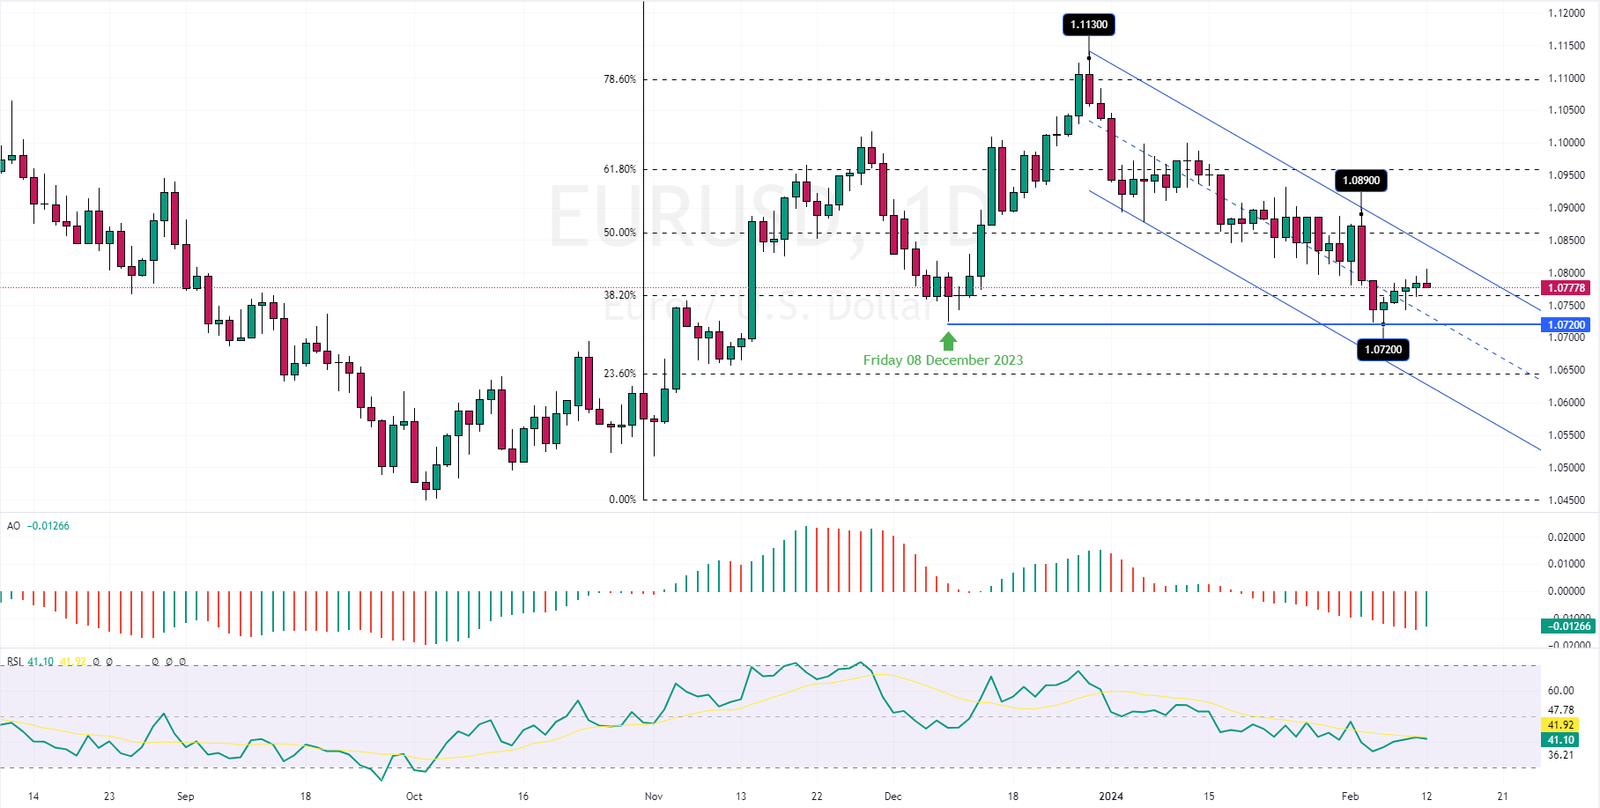
The EURUSD has been trading in a downtrend since December 28, 2023, after the pair’s price reached the 1.113 peak. Interestingly, the downtrend has eased near the December 8, 2023 low, the 1.072 mark shown in the daily chart below.
EURUSD Technical Analysis and Forecast
Considering today’s trading session’s awesome oscillator bar turned green, please note that this could be a correction phase; since the pair trades in the bearish channel, the consolidation phase might extend to the upper band of the flag.

The EURUSD 4-Hour Chart Analysis
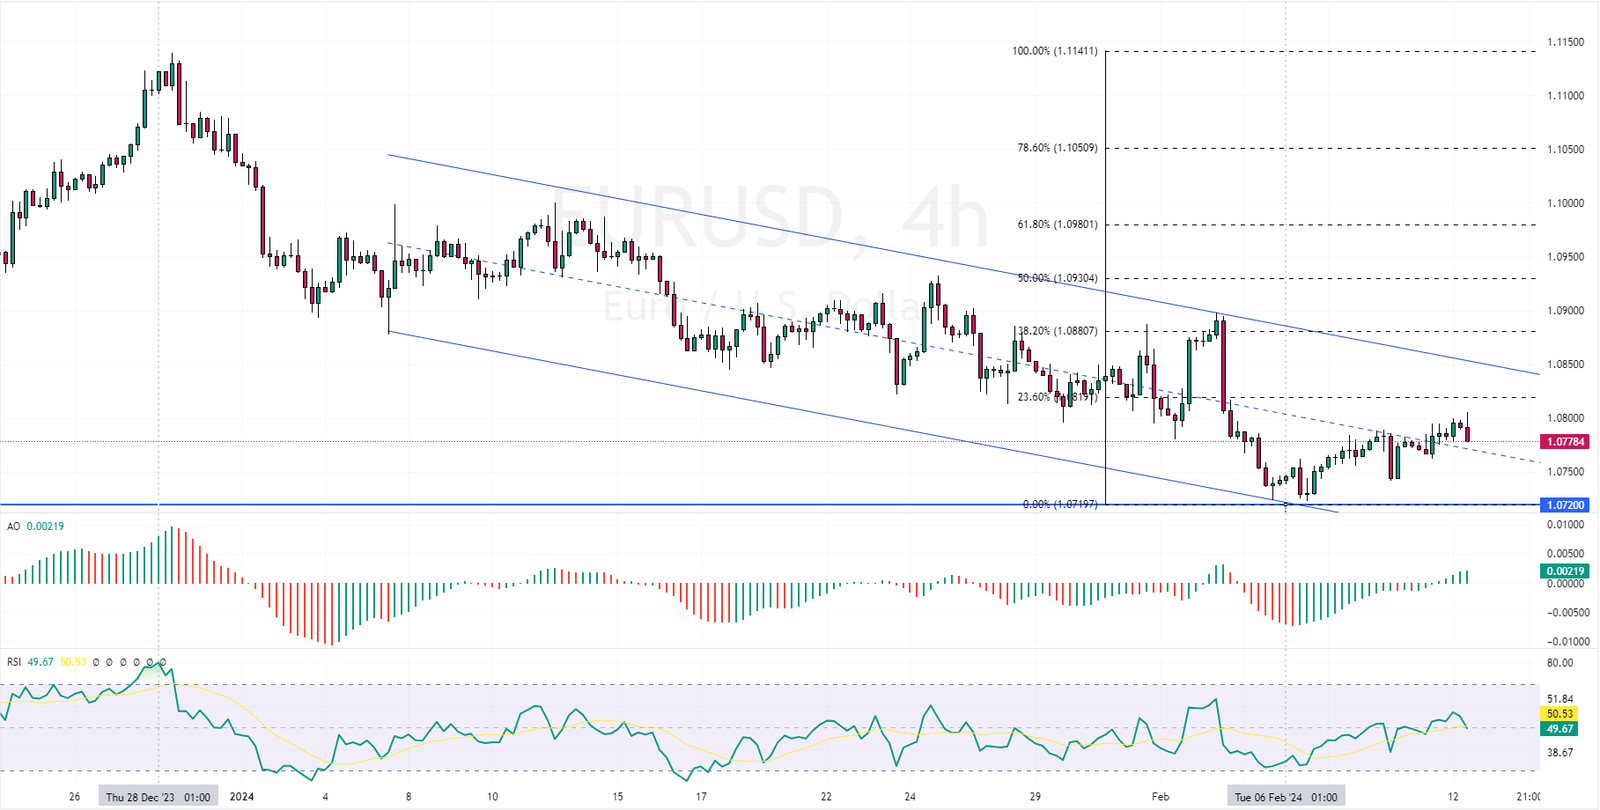
The EURUSD price trades around 1.07, above the median line of the bearish channel in the 4-hour chart. The technical indicators are bullish, but the uptick momentum seems weak. Therefore, it is not likely for bulls to be able to push the price higher than the 38.2% Fibonacci resistance level, the 1.088 mark. Analysts at FxNews suggest closely monitoring this Fibo level and the upper band of the channel for candlestick patterns.
The 1.088 could provide a decent price for the bears to increase their bids. If the price maintains its position in the downward flag, it might see another decline to recent lower lows around 1.072, followed by the 1.064 mark.

Conversely, the bearish technical analysis should be invalidated if the EURUSD price exceeds the 38.2% Fibonacci level. In this scenario, the road to the 1.093 will be paved.
European Stocks Rise, Nearing Records Amid Earnings
European stocks rose slightly on Monday, continuing the upbeat trend from last week. Investors look forward to new company earnings and economic data to better understand the economy’s response to long-term high interest rates. The Eurozone’s Stock 50 index increased by 0.3%, reaching a 23-year peak of over 4,730, while the Stoxx 600 index also saw gains, approaching all-time highs of more than 485.
Stocks in the significant consumer cyclical sector led the way, thanks to this month’s encouraging reports from Hermes, LVMH, and Ferrari, with their shares increasing by 0.6% to 1%. L’Oreal’s shares also rose nearly 2%, recovering from last Friday’s drop caused by a poor reaction to its earnings announcement.
Meanwhile, banks and insurance companies performed well, benefiting from lower Eurozone bond yields. In other business news, BASF plans to sell its share in two chemical plants in China.