FxNews – The right tool in forex trading can make a massive difference between a bad and a good trade. Besides the price action techniques such as candlestick patterns and drawing trendlines, technical indicators can serve well if used correctly.
The MetaTrader 5 technical indicator we are representing and explaining today plays a vital role in determining trend directions and potential trend reversals when trading securities. The buy-sell indicator is a noteworthy asset for forex traders to use to pick when and where to enter the market or exit from a trade, either with profit or loss.
In this article, we delve into details to illuminate the indicator’s mechanisms, pros, cons, and practical trading samples in the ever-evolving trading landscape.
What Does the Buy Sell Indicator Mean?
As the name suggests, this MetaTrader 5 indicator is designed to streamline the trading process by offering easy-to-understand buy and sell signals. Traders don’t have to bother themselves with complex mathematical calculations; the ‘buy sell indicator’ does everything. This technical tool identifies potential trend reversal and continuation in the market. In addition to the entry point, the indicator signals when and at what price to exit a trade.
Example: The daily chart below pertains to the EURUSD currency pair. As depicted in the image, the red dot above the candlestick is the sell signal. Specifically, on 2023.11.30, the indicator issued a sell signal. Consequently, the outcome of the trade was a gain of +120 pips.

Buy Sell Indicator Mechanics and Functionality
This trading tool integrates technical and analytical components like moving averages, volatility assessments, and price action patterns. Once the indicator is attached to a Forex chart, the analysis begins, and you will see green and red dots either below or above the chart. These represent optimal entry or exit points for your trades based on the underlying algorithm explained earlier.
Example: The EURUSD 1-hour chart below offers another perspective of the Buy Sell indicator. In this particular instance, the indicator issued more false signals. This is primarily because the time frame is smaller than the 4-hour chart. It’s important to note that most technical indicators have less accuracy in lower time frames.

Buy Sell Indicator Pros
Simplicity and User Accessibility: The indicator is famous for its simple and easy-to-understand user interface. The signals are straightforward and can be used by beginners and professionals in their technical analysis.
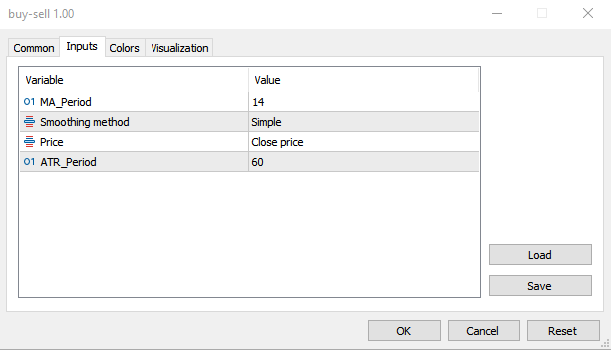
Adaptivity: The buy-sell MetaTrader 5 technical indicator can be adjusted according to traders’ trading strategies. The indicator’s settings allow you to change the moving average period, smoothing method, and ATR period.

The higher the moving average value, the more signals the indicator will show and the more suited it is for long-term trading. But for scalpers, the MA_Period can be set to 14 or less. Traders should try different settings to match their trading strategies best. Since the market shifts and changes constantly, traders should adjust the buy-sell MT5 indicator settings accordingly.
Integration and compatibility: This technical indicator matches the MetaTrader 5 platform, which is currently the most popular trading platform. It can be attached to any Forex chart by drag-and-drop.
Buy Sell Indicator Strategic Applications and Techniques
Capitalizing on trends: The buy-sell indicator identifies the primary trend, a valuable asset for trend-following strategies. As you might be aware, the following strategy often leads to substantial gains.
Refining Swing Trading: The buy-sell tool is a good indicator for trend-following strategies and can also be handy for swing trading strategies. The indicator pinpoints entry and exit points by marking the chart with red and green dots. Traders can minimize trading risks by setting the stop loss near the dots.
How to Set Stop Loss with Buy Sell Indicator

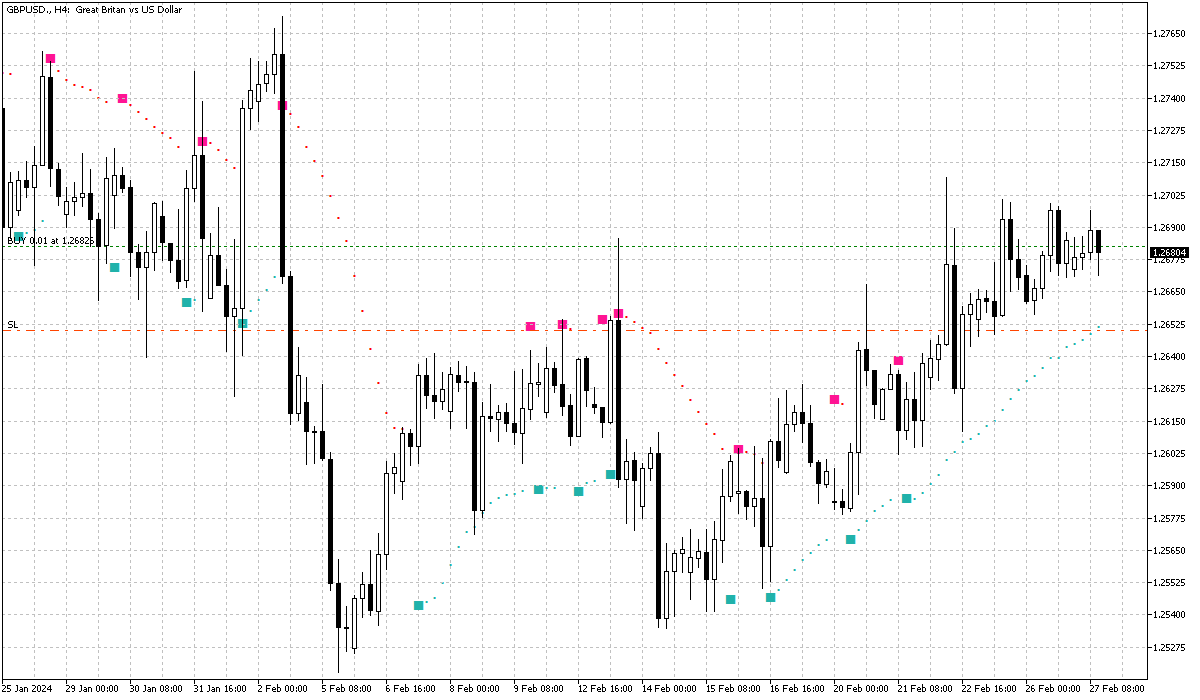
In the GBPUSD 4-hour chart above, we executed a 0.01 lot trade at 1.2682. This decision was made because the pair trades above the ‘Buy Sell indicator.’ In this scenario, the stop loss should be set below the last green dot created by the indicator. If the market shifts downward, the stop loss will be triggered. This strategy helps to prevent losses exceeding our trade expectations.
Understanding the Limitations of the Buy Sell Indicator
Inherent Delays: Like any other technical indicator, the ‘Buy Sell Indicator’ is not an exception when it comes to lagging. This might result in a delay in receiving signals from the chart. However, the extent of the delay depends on the time frame used. The delay is more pronounced on higher time frames, such as 4-hour and daily charts.
False Signals and Market Noise: Indicators often give mixed or incorrect signals when the market is impacted by significant news or events. Therefore, the indicator might generate false signals when high-impact financial news is released. Professional traders usually monitor the economic calendar to avoid falling into the market’s black hole, where the trading security might exhibit erratic movements and gaps.
Complementary Strategies Required: For the best outcome, traders should utilize the ‘Buy Sell Indicator’ alongside other analytical tools, such as fundamental analysis or momentum technical indicators. This approach helps to filter out false signals for a more precise trading strategy.
Decoding the ‘Buy Sell Indicator’ With live Chart Example
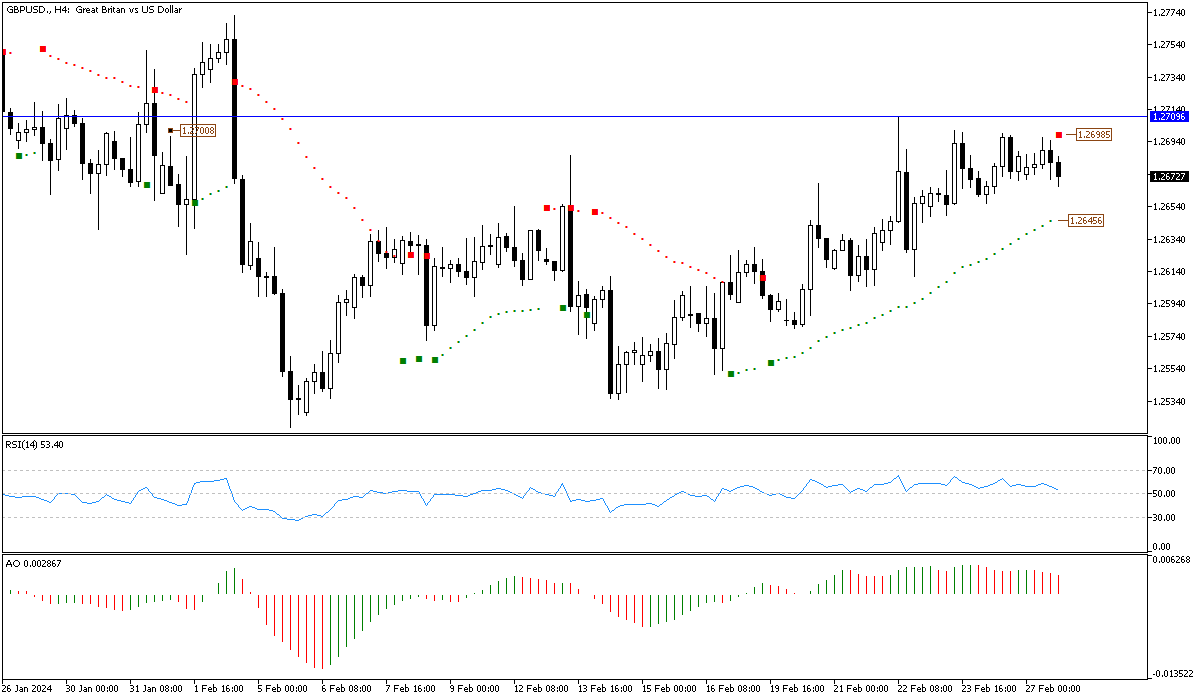
So far, we have understood the ‘Buy Sell Indicator,’ how it calculates the signals, and the pros and cons of using the indicator. We provide a real example from a MetaTrader 5 chart to better understand its functionality. In this example, we added the RSI and the Awesome Oscillator to the chart to filter out noise.

The sterling pound is currently trading around 1.2673 against the U.S. dollar. The upward momentum has eased after the GBPUSD price reached 1.2709. The ‘Buy Sell Indicator’ has created a red dot above the current bearish candlestick in the 4-hour chart. Other technical indicators align with the ‘Buy Sell Indicator,’ with the RSI indicator closing below the 50 lines and the Awesome Oscillator bars in red.
As a result of this technical analysis, with the help of our new ‘Buy Sell Indicator,’ the price might see further decline. This is a swing trading strategy where we utilize the tools to sell when the price is high and buy when the price is low. The next step is to find the first profit point. According to the ‘Buy Sell Indicator’ rules, the first target should be the last green dot in a bearish trade.
In conclusion, with the ‘Buy Sell Indicator’ signal, we execute a sell order with the stop loss set at 1.2698. The expected reward should be the 1.2645 mark, as shown in the GBPUSD 4-hour chart.