In today’s comprehensive GBPAUD forecast, we will first examine the current economic conditions in the United Kingdom. Then, we will meticulously delve into the details of the technical analysis of the GBPAUD pair.
UK Housing Market in a Downward Trend
Bloomberg—In October 2023, the UK housing market experienced a downturn, with the Halifax House Price Index reporting a 3.2% decrease compared to the previous year. This follows a revised drop of 4.5% in September. The forecast suggests that this downward trend will likely continue in the coming months due to weak demand and high borrowing costs.
The decline in house prices was observed across all regions and nations in the UK. Southeast England was hit the hardest, witnessing a substantial 6.0% price drop over the past year. London’s real estate market was not spared either, with property prices falling by 4.6%.
Despite the overall downward trend, there was a slight uptick in October, with house prices rising by 1.1% monthly. This breaks a six-month streak of consecutive decreases and is largely due to a limited number of homes available for sale.
GBPAUD Forecast – Potential Reversals
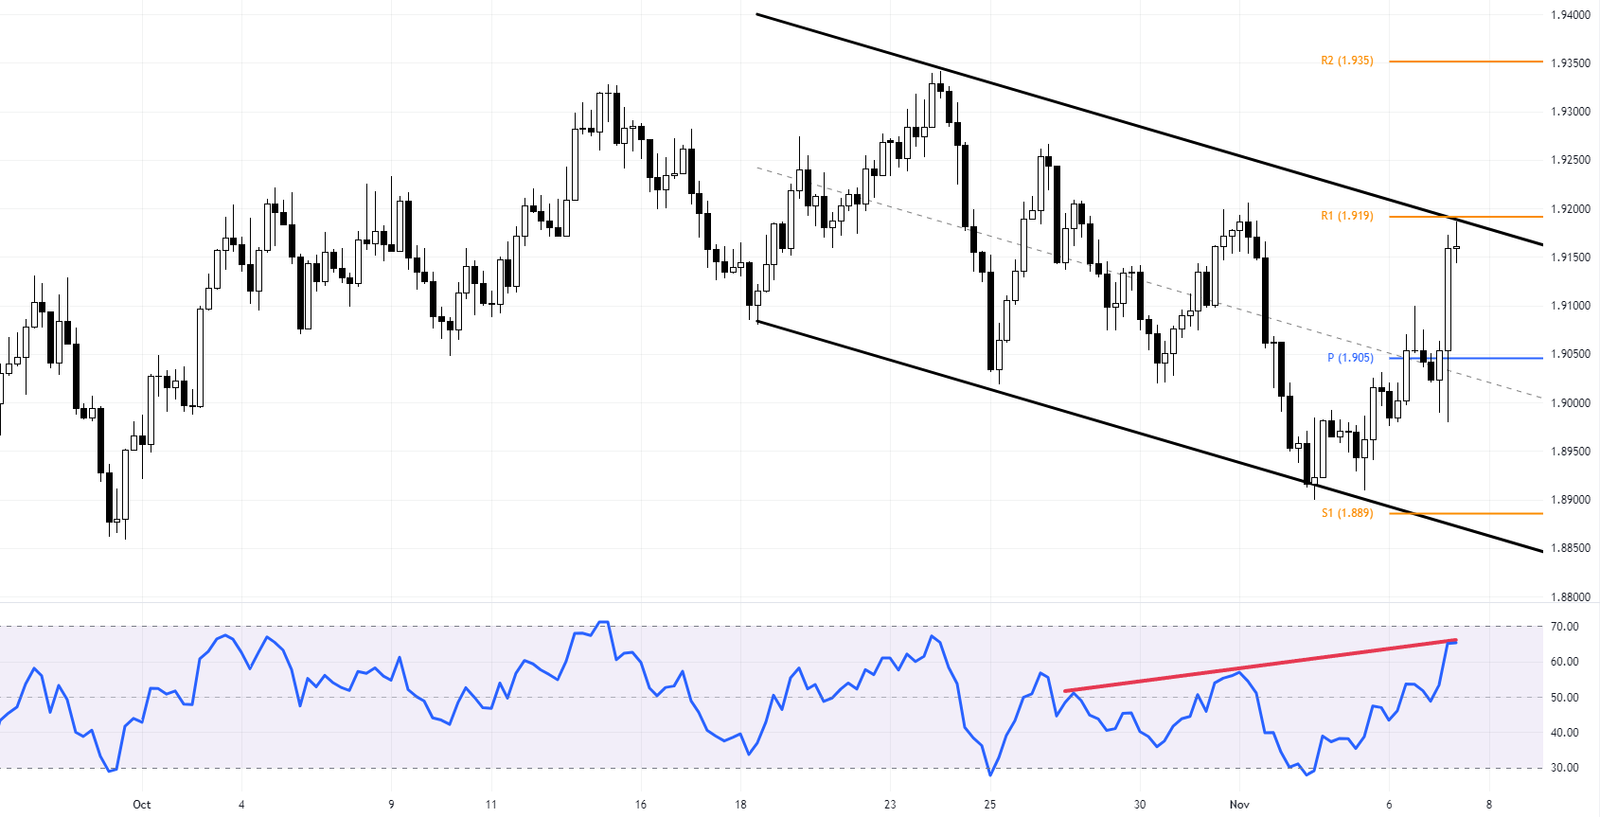
The GBPAUD currency pair is currently experiencing a bounce from the S1 support level (1.895), testing the upper line of the bullish channel. The market shows bullish tendencies, with the RSI indicator flipping above 50. However, the question remains: Will the GBPAUD bulls be able to break out of the bearish channel?

To gain a more detailed perspective, let’s delve into the 4-hour chart of the GBPAUD currency pair. The situation on the 4H chart mirrors the daily chart, with one notable exception. The RSI indicator signals divergence, indicating a potential market correction or trend reversal. As the price continues to hold below the R1 resistance level (1.919), the downtrend will likely continue, targeting the 1.905 pivot, followed by the 1.889 (S1) level.

Conversely, if the bulls break out of the bearish channel to secure a close above R1 and maintain stability, they will pave the GBPAUD bulls’ path to 1.935. This scenario would represent a significant shift in the GBPAUD market dynamics.
Stay tuned for more updates on the GBPAUD forecast and potential market trends. Investing in currency pairs involves risk, and making informed decisions based on thorough research and analysis is essential. Always consult with a financial advisor before making any investment decisions.