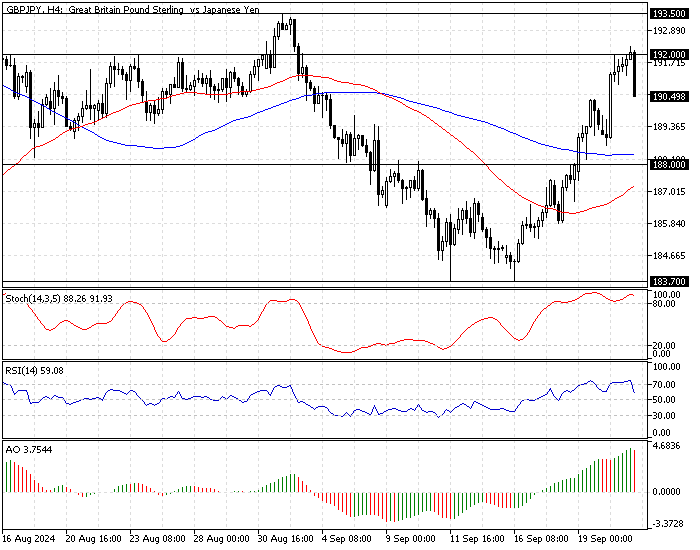
FxNews—The British pound’s bullish wave from 183.7 cooled when the price peaked at the August 16 high, the 192.0 mark, against the Japanese Yen. This development in the currency pair resulted in the Stochastic oscillator and the relative strength index, signaling an overbought market.
As of this writing, the GBP/JPY price is dipping from the 192.0 critical resistance as expected, trading at approximately 190.5. The daily chart below demonstrates the price, support, resistance levels, and technical indicators used in today’s analysis.

GBPJPY Technical Analysis – 23-September-2023

From a broader perspective, the GBP/JPY primary trend is bullish because the price is above the 50- and 100-period simple moving averages, as shown in the 4-hour chart above, and the Awesome oscillator bars are above the signal line.
However, the recent AO bar changed its color to red, meaning the bear market strengthened. Adding to the Stochastic and the RSI 14 overbought signals, we can conclude that the GBP/JPY price could erase some of its recent gains near the lower support levels.

As for the harmonic pattern, the GBP/JPY 4-hour chart formed a bearish bat pattern, signaling a bear market.
GBPJPY Forecast – 23-September-2023

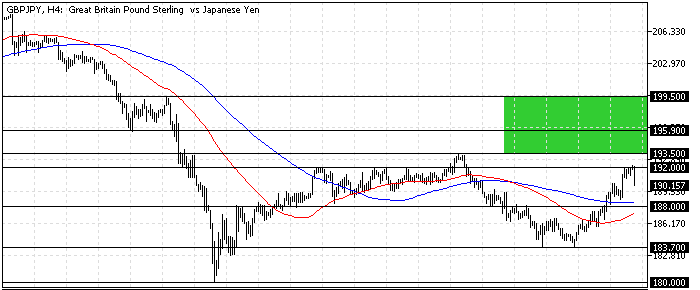
The immediate resistance lies in a narrow range between 192.0 and 193.5. If the bears hold the GBP/JPY price below this range, a bearish wave will likely be triggered. In this scenario, the current downtick momentum could extend to the 100-period simple moving average at about 188.0, which neighbors the September 9 low.
Furthermore, if the selling pressure pushes the price below 188.0, the next bearish target could be 183.7, the September 11 low.
Please note that the bear market should be invalidated if the GBP/JPY price exceeds the 193.5 (September 02 High) resistance.
- Also read: USD/PLN Forecast – 23-September-2024
GBPJPY Bullish Scenario – 23-September-2023
If bulls close and stabilize the GBP/JPY exchange rate above 193.5, the uptrend that began at 183.7 will likely expand to the July 25 High at 195.9.
Furthermore, if the buying pressure leads to a price beyond 195.9, the next bullish barrier will be 199.5, the July 30 High.
GBPJPY Support and Resistance Levels – 23-September-2023
The daily chart below demonstrates the price, support, resistance levels, and technical indicators used in today’s analysis.
- Support: 188.0 / 183.7 / 180.0
- Resistance: 192.0 / 193.5 / 195.9 / 199.5

J.J Edwards is a finance expert with 15+ years in forex, hedge funds, trading systems, and market analysis.


