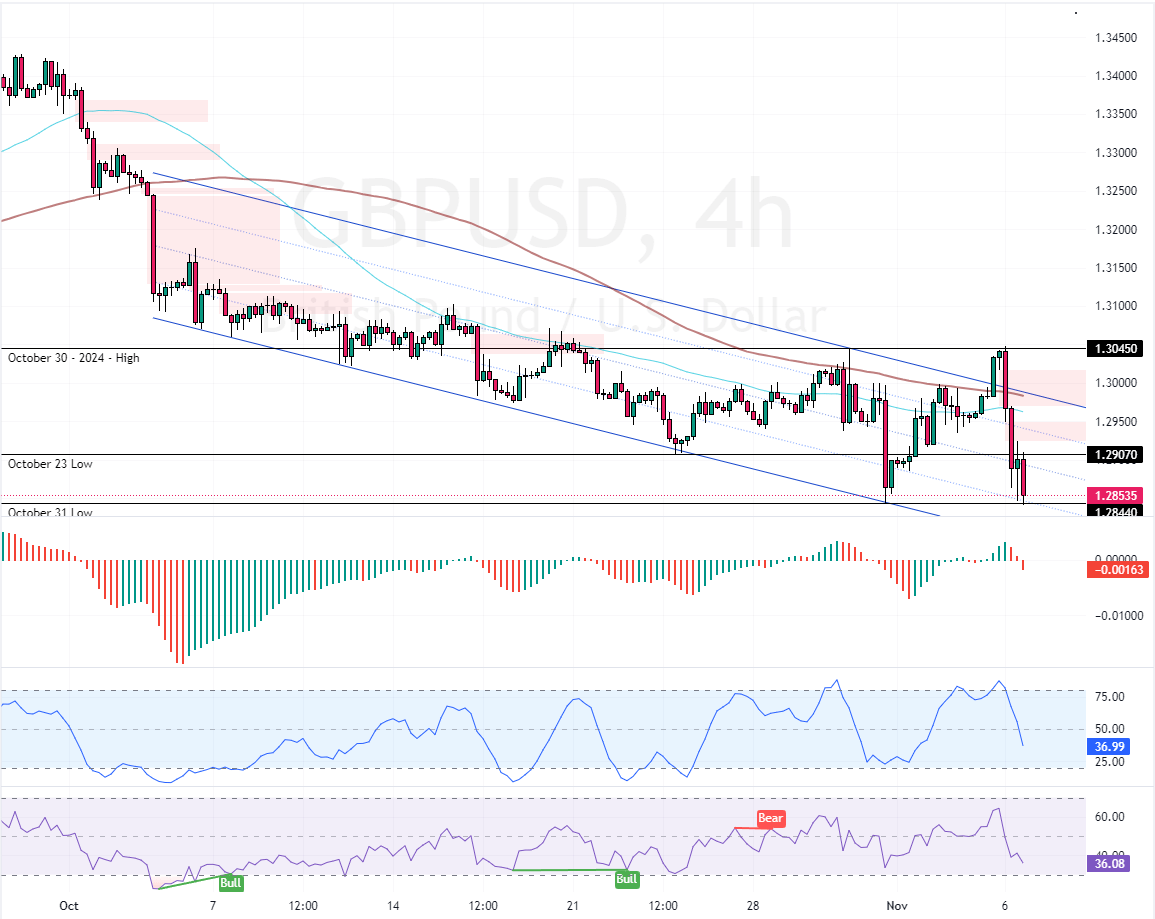
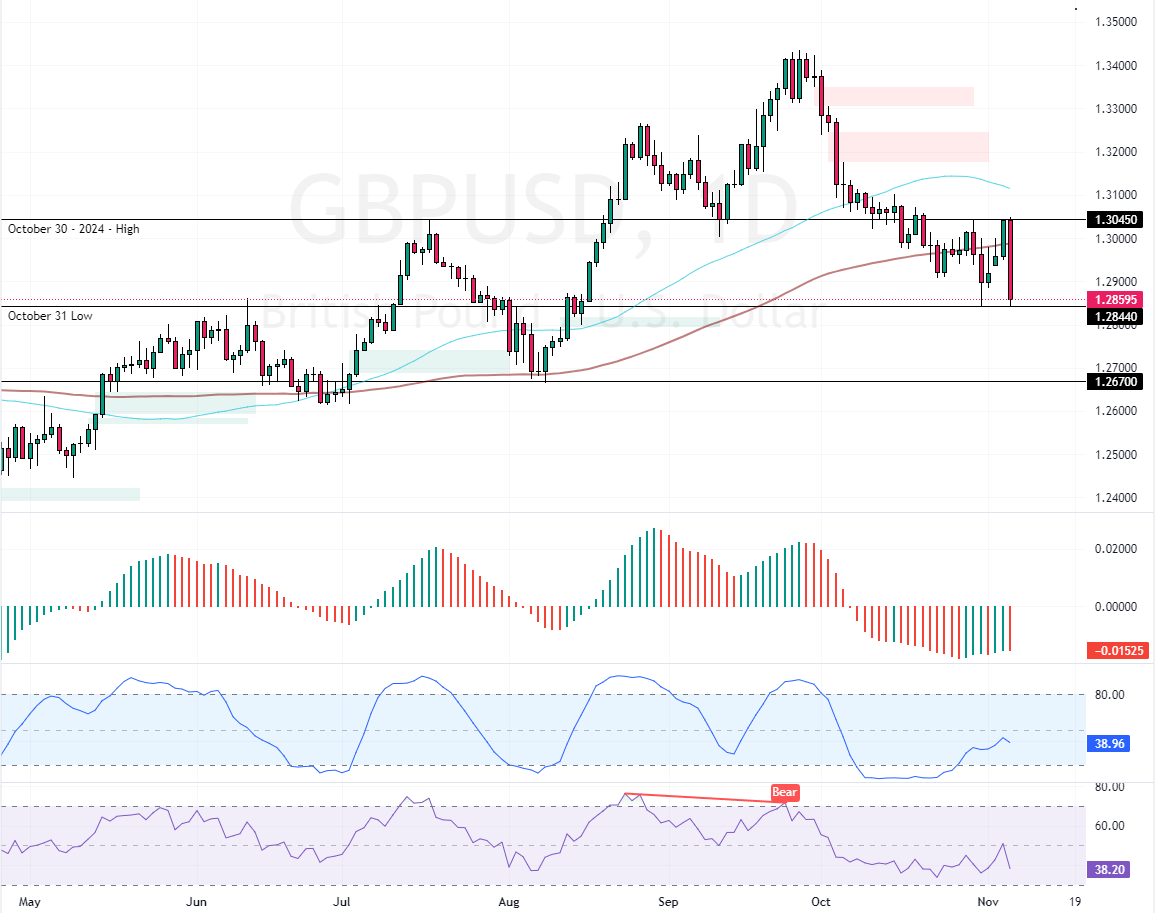
FxNews—The GBP/USD began its bearish trajectory after the price failed to stabilize above the 100-period simple moving average. As a result, the currency pair fell sharply from $1.304. As of this writing, the GBP/USD bears are testing the October 31 low at $1.284 as support.

GBPUSD Technical Analysis – 6-October-2024
As for the technical indicators, the Awesome Oscillator flipped below the signal line with red bars, meaning the bear market strengthened. Furthermore, the Stochastic Oscillator and RSI 14 are declining, depicting 36 and 35 in the description.
This development in the momentum indicators suggests the GBP/USD is not oversold, so the downtrend has the potential to extend.
GBPUSD Faces Key Resistance at $1.284

The October 31 low at $1.284 is the immediate resistance. From a technical standpoint, the downtrend should resume if bears close and stabilize GBP/USD below $1.284. In this scenario, the next bearish target could be $1.267.
Please note that the bearish outlook should be invalidated if the GBP/USD price exceeds the October 30 high of $1.3045, which is active resistance.
- Support: 1.284 / 1.267
- Resistance: 1.2907 / 1.3045