Friday, November 22, 2024
3.5 C
London

Gold Market Analysis – Is $1884 the Key Player?

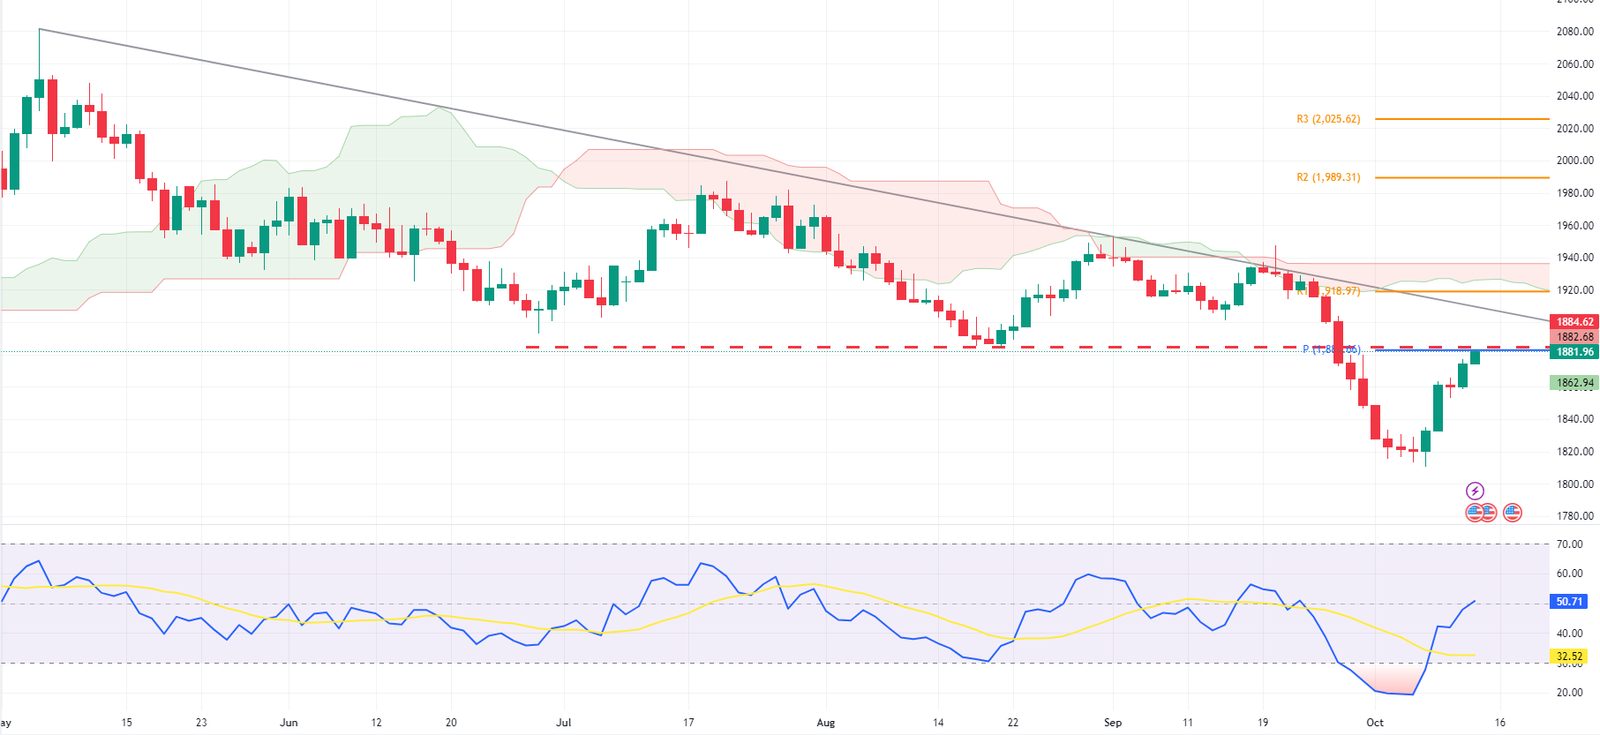
FxNews – Gold trades near a pivotal resistance level at $1,884. The Relative Strength Index (RSI) indicator is crossing above the 50 line, indicating a strong bullish sentiment. However, gold trades close to this strong key resistance level ($1,884).

We need to delve into the 4-hour chart for a more detailed technical analysis of gold to gain a deeper understanding of the price action.
Gold Market Analysis - Is $1884 the Key Player?
Gold Market Analysis – Is $1884 the Key Player? – Daily Chart
Gold Market Analysis - Is $1884 the Key Player?
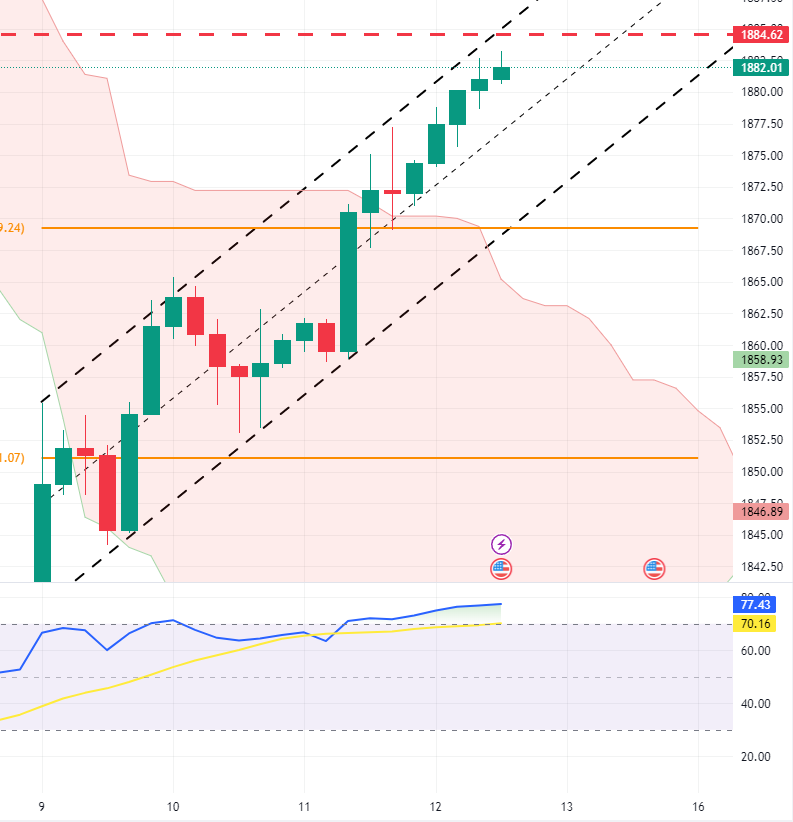
Gold Market Analysis – Is $1884 the Key Player? – 4H Chart

Gold Surges Above Ichimoku Cloud Eyeing $1,884 Break

In the 4-hour chart, the yellow metal has moved above the Ichimoku cloud, and the RSI hovers in the overbought area. This is a crucial stage for XAU/USD bulls. If they can close above the $1,884 resistance level, the next target will be the descending trendline in the daily chart. Therefore, monitoring candlestick patterns around this level in the 4-hour chart is recommended.

A long-wick candlestick pattern or a doji in the 4-hour chart could suggest that the uptick movement is likely over and that the XAUUSD price is ready to decline and follow the main trend, which started in mid-May.
Gold Market Analysis - Is $1884 the Key Player?
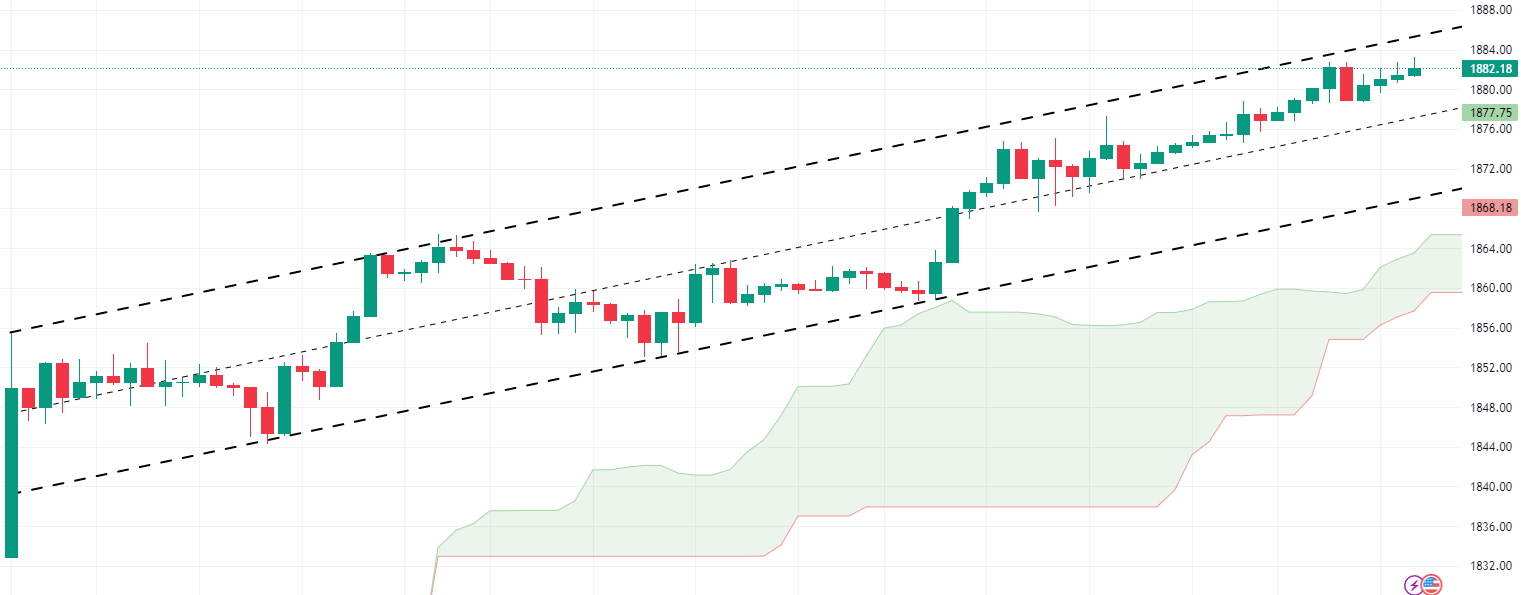
Gold Market Analysis – Is $1884 the Key Player?

When we zoom into the 1-hour chart, we see gold trading above the Ichimoku cloud and within a bullish channel. Another signal for entering short in gold is to wait for bears to decline the price and break below this channel. If gold’s price falls below the cloud, we can assume that the bearish trend will continue.

Summary

In conclusion, the $1,884 resistance level plays a pivotal role here. If bulls close above it, we can expect gold’s price to rise to the next resistance level. On the other hand, if bears manage to keep gold’s price below $1,884, we could see a continuation of the decline from the main bearish trend.

Latest Posts

Solana Tests All-Time Highs Amid Overbought Signals

Solana trades in a robust bull market, above the...

Litecoin Eyes $99 Target Above Key Fibonacci Level

FxNews—Litecoin prices held firm above the %50 Fibonacci retracement...

Ethereum Rebounds from Fibonacci Level Eyeing $3700

FxNews—Ethereum prices bounced from the 38.2% Fibonacci retracement level...

Bitcoin Surges Past $95K Despite Overbought Signals

FxNews—Bitcoin trades bullish, ignoring overbought signals from the momentum...

NATGAS Rises 5.4% Amid Cold Weather and Geopolitical Tensions

Over the past two days, natural gas prices in...

NATGAS Rises 5.4% Amid Cold Weather and Geopolitical Tensions

Over the past two days, natural gas prices in...

Crude Oil Prices Test $69.5 Amid Escalating Global Tensions

WTI crude oil futures rose to approximately $69.5 per...

Gold Surges Above $2650 as Russia-Ukraine War Escalates

Gold prices exceeded the 38.2% Fibonacci level, trading at...

Gas Prices Near Year High as Cold Snap Threatens Europe

Prices for European natural gas futures approached €47 per...

U.S. Gasoline Futures Hit Two-Week High at $2.05

Gasoline futures in the U.S. peaked at $2.05 per...

Silver Rally Halts at $31.4 Amid Solar Panel Surplus

FxNews—Silver prices eased to $30 per ounce as the...

Oil Prices Stable $69 as Geopolitical Risks Soar

FxNews—WTI crude oil futures remained above the $66.8 critical...

WTI Crude Dips to $68.5 as Norway Field Restarts

On Tuesday, WTI crude oil futures decreased to $68.5...
spot_imgspot_img