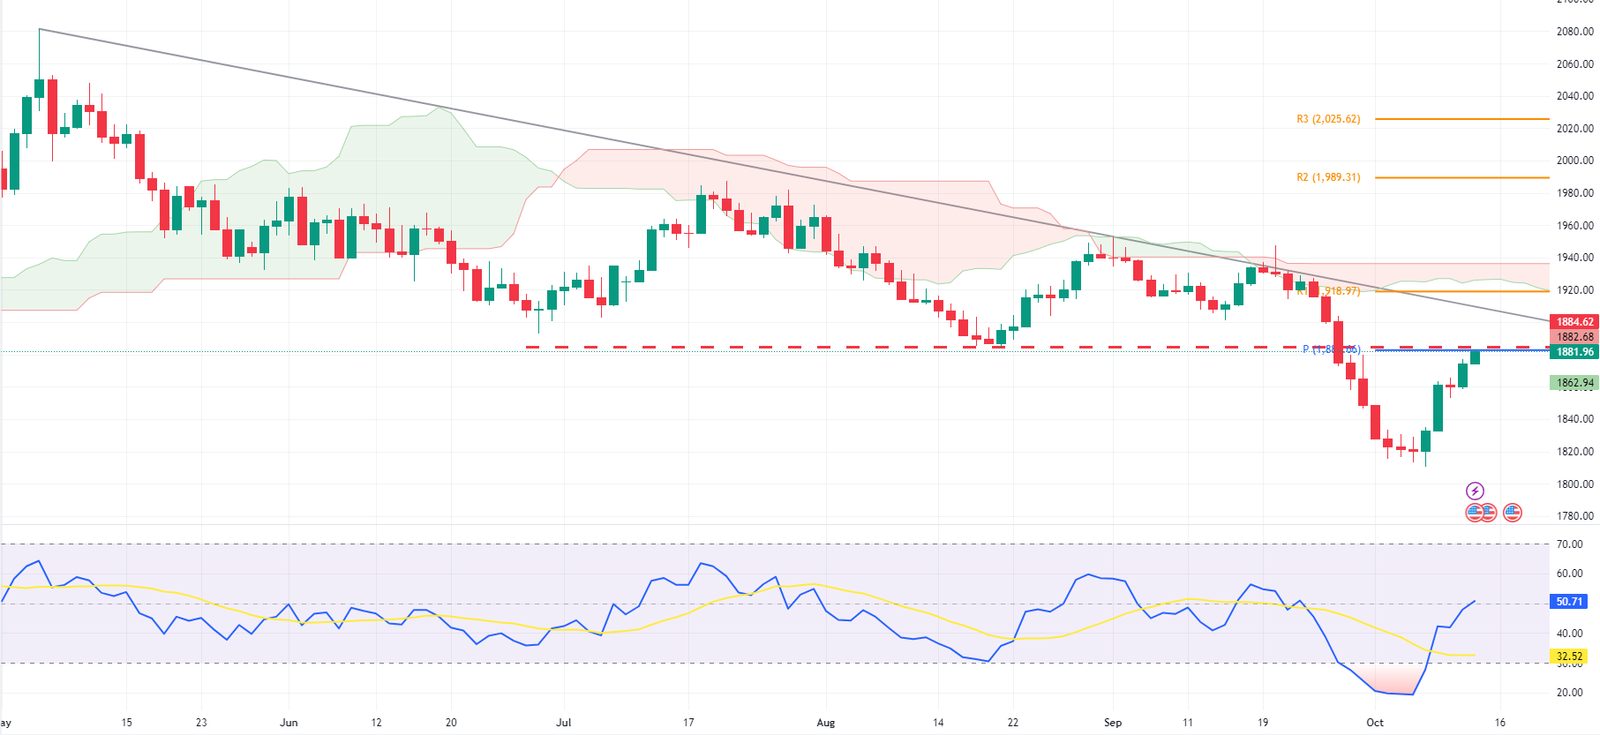
FxNews – Gold trades near a pivotal resistance level at $1,884. The Relative Strength Index (RSI) indicator is crossing above the 50 line, indicating a strong bullish sentiment. However, gold trades close to this strong key resistance level ($1,884).
We need to delve into the 4-hour chart for a more detailed technical analysis of gold to gain a deeper understanding of the price action.


Gold Surges Above Ichimoku Cloud Eyeing $1,884 Break
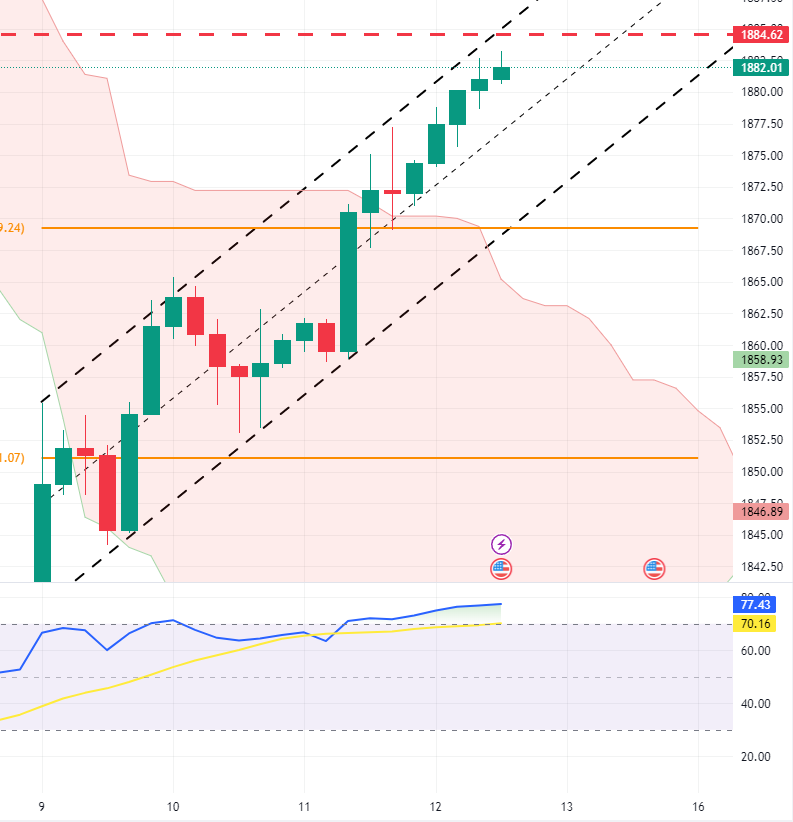
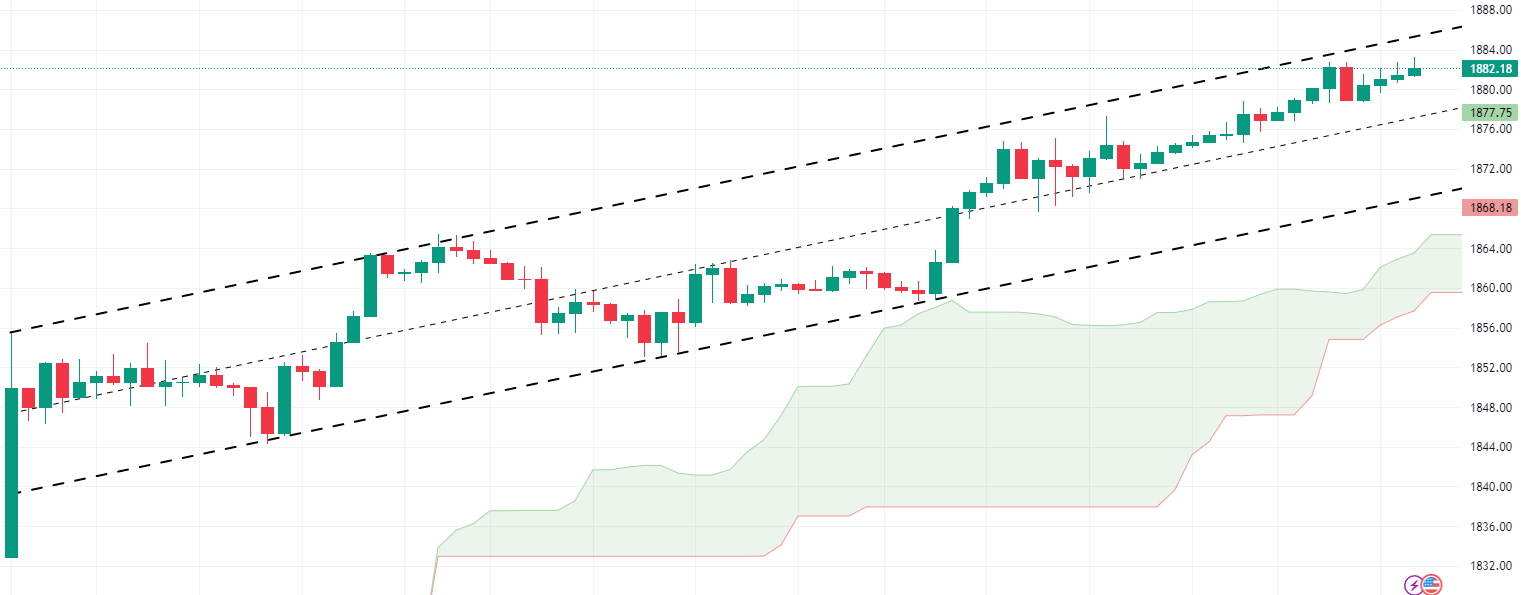
In the 4-hour chart, the yellow metal has moved above the Ichimoku cloud, and the RSI hovers in the overbought area. This is a crucial stage for XAU/USD bulls. If they can close above the $1,884 resistance level, the next target will be the descending trendline in the daily chart. Therefore, monitoring candlestick patterns around this level in the 4-hour chart is recommended.
A long-wick candlestick pattern or a doji in the 4-hour chart could suggest that the uptick movement is likely over and that the XAUUSD price is ready to decline and follow the main trend, which started in mid-May.

When we zoom into the 1-hour chart, we see gold trading above the Ichimoku cloud and within a bullish channel. Another signal for entering short in gold is to wait for bears to decline the price and break below this channel. If gold’s price falls below the cloud, we can assume that the bearish trend will continue.
Summary
In conclusion, the $1,884 resistance level plays a pivotal role here. If bulls close above it, we can expect gold’s price to rise to the next resistance level. On the other hand, if bears manage to keep gold’s price below $1,884, we could see a continuation of the decline from the main bearish trend.