Discover the latest GBPUSD analysis with our expert insights. We update our GBPUSD technical analysis regularly, shedding light on the trend direction and technical indicators. At the end, we provide a detailed GBPUSD forecast based on recent economic data.
So, if you are a fan of trading currency pairs, stay with us and bookmark this page to make informed trading decisions.
Table of Contents
GBPUSD Live Chart
The live chart below is from TradingView, a reliable source and platform endorsed by traders and investors worldwide. I featured the chart with my favorite indicators, which I utilize in almost all of my technical analyses.
GBPUSD Analysis: Key Resistance at $1.235
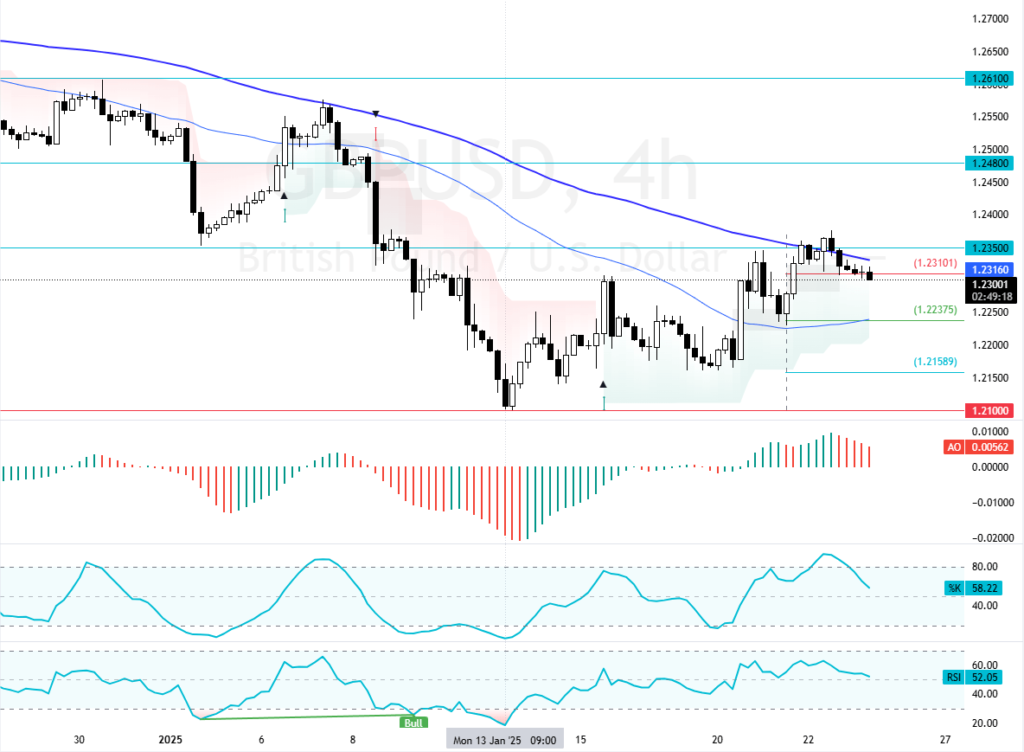
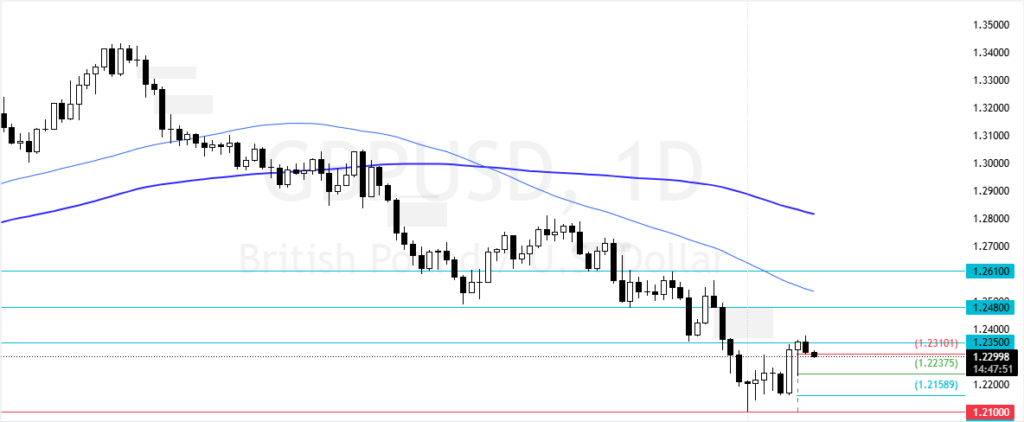
FxNews—The British Pound is in a bear market, trading below the 50- and 100-period simple moving averages in the 4-hour chart. The currency pair began consolidating from $1.210, resulting in a %2.0 gain since January 13. However, the uptick in momentum eased at $1.235 resistance, a level backed by the 100-period simple moving average.
As of this writing, Pound trades at approximately $1.231, stabilizing below the $1.235 key resistance level.
What Do Technical Indicators Reveal?
- The primary trend is bearish because the prices are below the 100-period simple moving average in the 4-hour chart.
- The RSI 14 value is 54.0 and moving sideways, meaning the market is uncertain.
- The Stochastic Oscillator value is 60.0 and declining, hinting at the downtrend.
- The Awesome Oscillator histogram is red, above zero, interpreted as the uptick in momentum is weakening.
Overall, the technical indicators suggest that the primary trend is Bullish, and should resume.
GBPUSD Technical Analysis: The Bearish Scenario
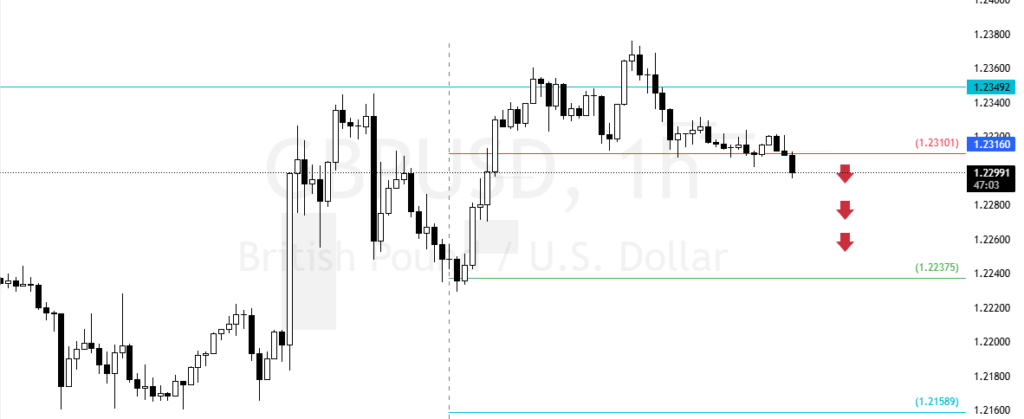
The immediate resistance is at $1.235. From a technical standpoint, the market outlook remains bearish as long as Pound Sterling is below $1.235. But bears must close and stabilize below $1.231 for the downtrend to be triggered.
In this scenario, the next bearish target could be $1.223, followed by $1.215. Please note that the bear market should be invalidated if the price exceeds $1.235.
The Bullish Scenario
The immediate resistance is at $1.235. If bulls pull GBP/USD above $1.235, the bullish wave from $1.210 will likely extend to higher resistance levels. In this scenario, the next bullish target could be $1.2480.
GBPUSD Support and Resistance Levels
Traders and investors should closely monitor the GBP/USD key levels below to make informed decisions and adjust their strategies accordingly as market conditions shift.
| Support and Resistance Levels | |||
|---|---|---|---|
| Support | 1.2310 | 1.2237 | 1.2158 |
| Resistance | 1.2350 | 1.2480 | 1.2160 |


