FxNews – The Relative Strength Index, or RSI, is a pivotal tool in the arsenal of many forex traders. It is known for its ability to gauge market momentum and potential price reversals. Developed by J. Welles Wilder in 1978, the RSI remains one of the most widely used technical indicators in trading due to its simplicity and effectiveness in identifying overbought or oversold conditions.
What is the Relative Strength Index?

The Relative Strength Index is a momentum oscillator that measures the speed and change of price movements from zero to 100. The formula for RSI is:
RSI=100− {100 / (1+RS)}
RS is the average gain of up periods during the specified time frame divided by the average loss of down periods. The standard period setting for RSI is 14, which can be adjusted based on the trader’s analytical needs and the specific market conditions.
Understanding RSI Values
RSI values range between 0 and 100, with readings above 70 typically indicating that a market is overbought, while readings below 30 suggest that a market is oversold. These thresholds can alert traders to potential reversal points where prices might start moving in the opposite direction.

The screenshot above is taken from the MetaTrader 5 platform. The RSI indicator defaults on this platform and is free to use. Therefore, you don’t have to pay to utilize this magnificent indicator in your technical analysis. The RSI is usually divided into three lines to understand the indicator better.
- The RSI zero line: The lowest value of the RSI
- The RSI 30 line: The market is oversold if the indicator’s value hovers below it.
- The RSI 50 line is also crucial as others since it signals the continuation of the trend. When the value hovers above 50 and marches toward 70, that is interpreted as a bull market that will likely resume. Conversely, if the value floats below 50 and closes to 30, we are in a bear market, and the bearish trend will likely extend further.
- The RSI 70 line is employed to spot an overbought market. If the RSI weight steps above 70, the market is saturated from buying pressure, and the price of the trading instrument might reverse or go sideways.
How to Use RSI in Trading Forex and CFD Products
Forex traders use RSI to identify possible entry and exit points. When the RSI crosses above 70, it may indicate that the market is overextended to the upside and could soon reverse; conversely, an RSI reading below 30 might signal an impending upward correction in a bear market.

The AUDUSD 4-hour chart above is an excellent example of how to understand the RSI values. The relative strength index value in this chart hovers around 67, slightly below 70. However, the value of the RSI was above 70 a few hours ago when writing, a signal for an overbought market. As depicted in the image, as the RSI decreases and makes a return to below 70, the value of the AUD/USD also experiences a dip. Therefore, when the indicator’s value exceeds 70 or becomes overbought, the trend can reverse or trade sideways to consolidate its recent gains.
In this scenario, the AUDUSD might experience a decline to EMA 50 at the 0.644 mark.
RSI Trading Strategies
There are various ways to trade with the relative strength index. In this part of the article, we review each strategy and provide an example to understand the concept better.
RSI Basic Trading Strategy
The basic RSI strategy’s trading form is straightforward, but traders and investors must know the high risk of using this method without utilizing other tools. Therefore, we do not suggest using this technique, but this approach is vital because it shows how the relative strength index indicator works.
In this method, traders might consider buying when the RSI dips below 30 and selling when it exceeds 70, assuming the price will revert to a mean. In other words, when the RSI steps above 70, the value of the trading instrument is too high to attract more buyers, and consequently, it goes into a recession, and the price declines.
Example of RSI Simple Trading Strategy

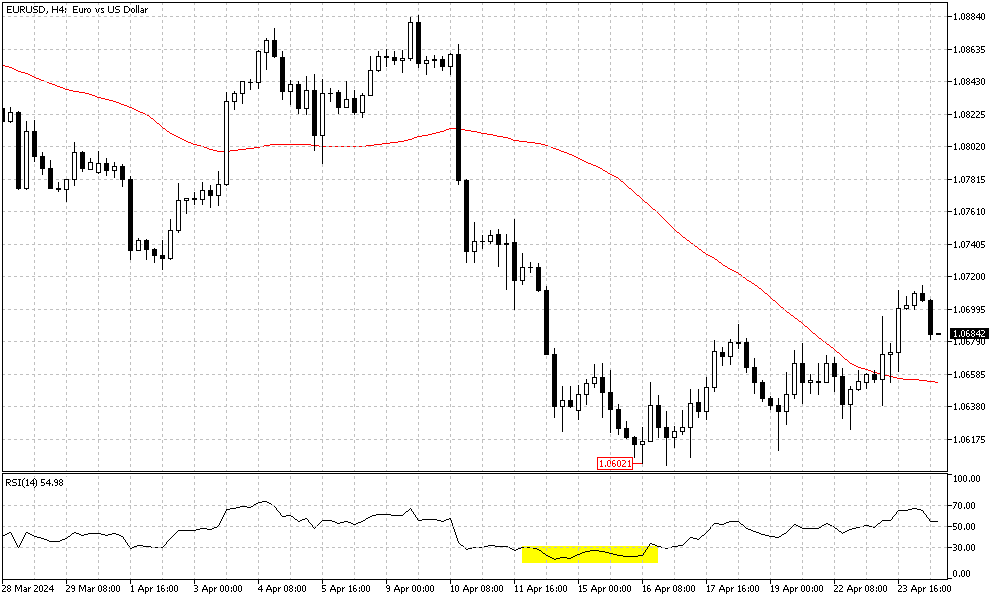
Please focus on the EURUSD 4-hour chart above, which shows the RSI dipped below 30. Concurrently, the Euro decline was extended to as low as 1.0602 against the U.S. Dollar. Interestingly, the 4-hour chart formed several bullish candlestick patterns, which indicate that the bear market is exhausted and that there might be a trend reversal or a consolidation phase on the horizon.
According to the simple RSI trading strategy, investors and traders should start placing buy orders at the 1.061 area where the RSI is below 50. The result is vividly shown in the image. The value of the EUR/USD increased and crossed above EMA 50; as of writing, it went as high as 1.072.
The result of this example is good, and traders can exit the market with a profit. However, as explained earlier, this strategy involves high risk.
RSI Advanced Trading Strategy: Mastering the Divergence
More sophisticated strategies involve looking for divergences where the price makes a new high or low that the RSI does not confirm. This divergence can be a strong indicator of an impending reversal.
Example of RSI Advanced Trading Strategy

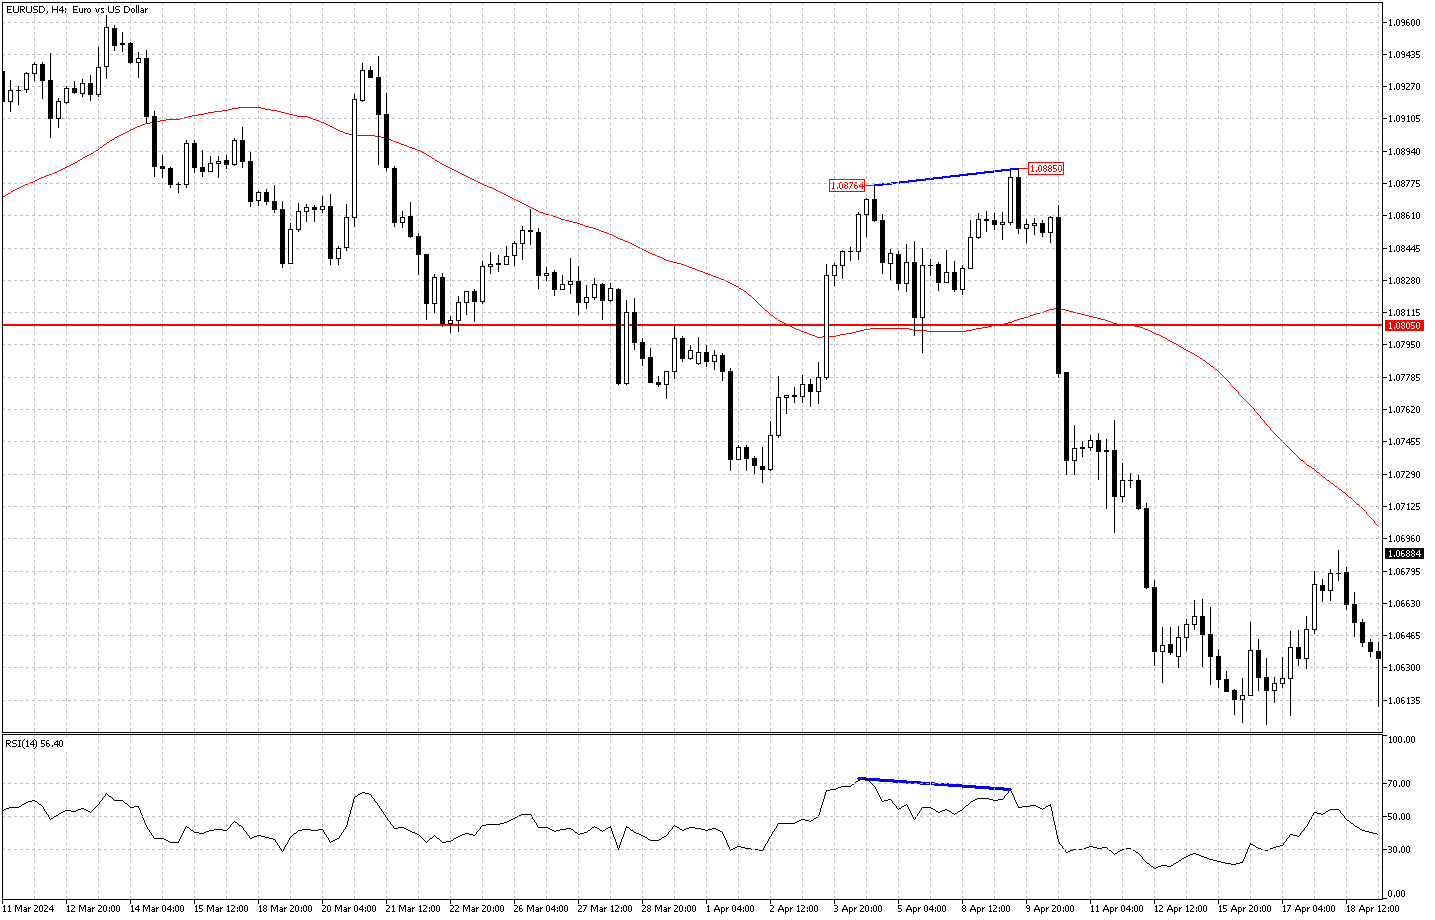
The chart above represents the EURUSD currency pair in the 4-hour time frame. I have marked the higher low and the higher high and connected them with the blue line, the 1.0876 and the 1.0885. The line is ascending, but as depicted in the image, the RSI does not confirm this, and the indicator is falling from 70 to 66, connected by a descending blue line. This contradiction between the EUR/USD price and the RSI is called divergence. A more powerful signal than the simple RSI trading strategy gives.
As a result, the European currency lost ground against the U.S. dollar, breaking down the 1.0805 resistance. The pace of the decline significantly increased until the EURUSD stepped into an oversold market.
The advanced RSI trading strategy that includes divergence is not just my favorite trading method; professional traders and investors also use it in their strategy.
Benefiting RSI with Other Technical Indicators
To increase the robustness of their trading signals, traders often use RSI in conjunction with other indicators like the Moving Average Convergence Divergence (MACD) or Stochastic Oscillator. For instance, a trader might look for scenarios where the RSI and MACD confirm a potential buy or sell signal.
In this technique, traders get overbought or oversold confirmations from the RSI and the Stochastic indicators. For their entering point, they can benefit from the MACD cross signal. Traders can also use a moving average to find safer entry points. In the following example, we explain this trading approach in detail.
Example of RSI with Other Indicators

The image above belongs to the GBPUSD chart, and the time frame is 4 hours. I use a higher time frame because the signals on the chart are more reliable compared to a lower time frame. In the lower time frames, such as 1 hour or 40 minutes, the technical indicators are influenced by higher market volatility, which usually leads to more false signals.
On April 8, 2024, the pound’s value peaked at 1.2893 against the U.S. Dollar after a week of increase. Since the market didn’t rest during the bullish wave, it became exhausted, and the RSI and the Stochastic indicator signaled bulls’ tiredness by stepping into the overbought area. To be more specific, the overbought zone for RSI is above 70, while for the Stochastic, it is above 80, highlighted in the image.
Interestingly, the GBPUSD chart formed a longwick bullish candlestick pattern at 1.2893, and after that, the market couldn’t hit that peak again. The decline started with a bearish candle and a few tiny candles afterward, which can be interpreted as uncertainty in the market.
So far, we have identified the overbought market with the RSI and the Stochastic indicator. The next step is to find entry points. The MACD cross signal is a decent tool for this purpose. On March 11, the MACD bars stepped below the MACD moving average at 1.2794. The bear market was approved after the GBPUSD price dipped below this minor resistance, and MACD signaled the entry point.
After the dip, the GBPUSD bears had to overcome the EMA 50 barrier. Later that week, the selling pressure increased, and the EMA 50 couldn’t hold any longer. Consequently, the pound’s decrease in value escalated and declined to as low as 1.2540, as shown in the image.
Limitations of the RSI Indicator
While RSI is a powerful tool, it is not without its limitations. During strong trends, the indicator can remain in overbought or oversold territory for extended periods, potentially misleading traders about reversal points. Additionally, false signals are a common trap, especially in volatile markets.

The USDJPY chart above illustrates the limitations of the RSI indicator. The U.S. Dollar has been in a robust uptrend against the Japanese currency, which twice drove the relative strength index indicator into the overbought area, as shown in the 4-hour chart below. The uptrend resumed once the pair rested from the extreme buying pressure.
In this example, I featured the chart with Bollinger bands, a technical tool that helps with the overall trend direction. The overbought market did not lead to a trend reversal, demonstrating how the RSI indicator can sometimes give false signals. Therefore, to filter the market traps, it is wise to utilize this indicator with other tools, such as moving averages.
For instance, traders can feature the chart with a 25 or 50 EMA (exponential moving average) and wait for the price to cross and stabilize itself below the EMA. Traders can adjust their entry points accordingly once the exponential moving average confirms the trend reversal.
Practical Tips for Implementing RSI in Trading
Traders are advised to use RSI as part of a comprehensive trading strategy. This involves setting appropriate risk management controls, such as stop-loss orders, and confirming signals with other technical indicators or chart patterns.
Conclusion
The Relative Strength Index is an indispensable tool in forex trading, providing critical insights into market conditions. However, like all technical indicators, its effectiveness is enhanced when used with other data points and within the context of a sound trading strategy.
References and Further Reading
Various resources are available to deepen their understanding of RSI, including Wilder’s original book, “New Concepts in Technical Trading Systems,” and more recent analyses and case studies in financial literature and online trading forums.
This article aims to provide a thorough overview of the RSI, equipping traders with the knowledge to incorporate this powerful indicator into their trading strategies effectively.