FxNews – The Ichimoku Cloud, or Ichimoku Kinko Hyo as it’s also known, is a handy technical indicator that helps traders determine the market trend and the significant support and resistance area. It was created by a Japanese journalist named Goichi Hosoda in the late 1930s. This article will help you understand how to trade using the Ichimoku cloud.
What is the Ichimoku Cloud Indicator

The Ichimoku Cloud is made up of five lines:
- Tenkan-sen (Conversion Line): This line is found by looking at the highest and lowest prices over the last nine periods and finding the middle point. The Tenken-sen line is red in the EURUSD 4-hour chart above, which features the Ichimoku Cloud indicator.
- Kijun-sen (Base Line): This line resembles the Tenkan-sen but looks at the last 26 periods instead. If you are curious about which line in Kijun-sen in the chart above is depicted in blue,
- Senkou Span A (Leading Span A): This line is the average of the Tenkan-sen and Kijun-sen, plotted 26 periods into the future.
- Senkou Span B (Leading Span B): This line is the average of the highest and lowest prices over the last 52 periods, also plotted 26 periods ahead.
- Chikou Span (Lagging Span): This line is the closing price but plotted 26 periods behind. It is usually presented in lime green on a forex chart featuring an Ichimoku cloud.
The ‘cloud’ or ‘Kumo’ is formed by the space between Senkou Span A and Senkou Span B. The cloud’s color changes depending on whether Senkou Span A is above or below Senkou Span B.
The cloud is an essential asset of this indicator because it represents the support and resistance zones.

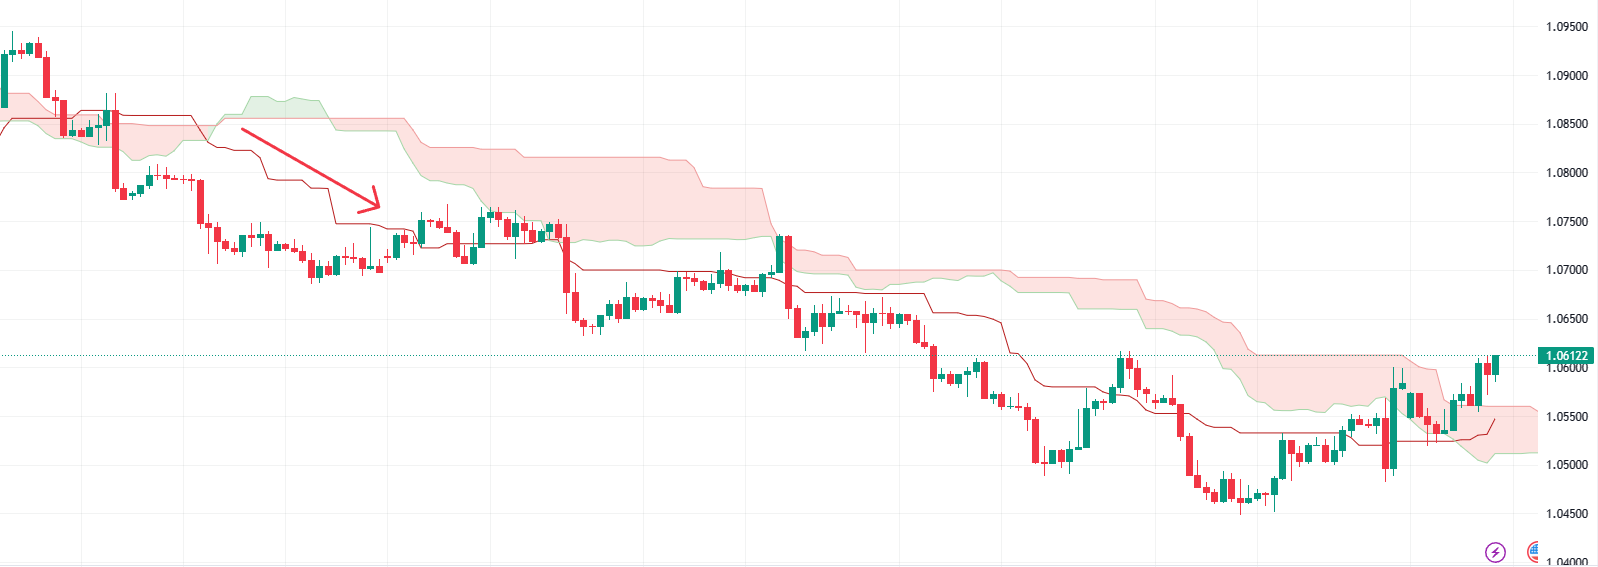
The EURUSD 1-hour chart below is an excellent example of how the Ichimoku cloud draws the support and resistance areas on the chart—the price of the EURUSD hovers below the cloud, which can be interpreted as a bear market.
Conversely, the bear market should be invalidated if the security’s price flips above the cloud. In this scenario, the market will likely shift from a downtrend to an uptrend.
How to Trade Ichimoku Cloud
One of the first things trades can do with the Ichimoku Cloud is identify market trends. This is vital for traders and investors because trading the forex market against a trend involves a higher risk.
Here’s how we can determine the market trend.
- If prices are above the cloud, we’re in a bullish (upward) trend.
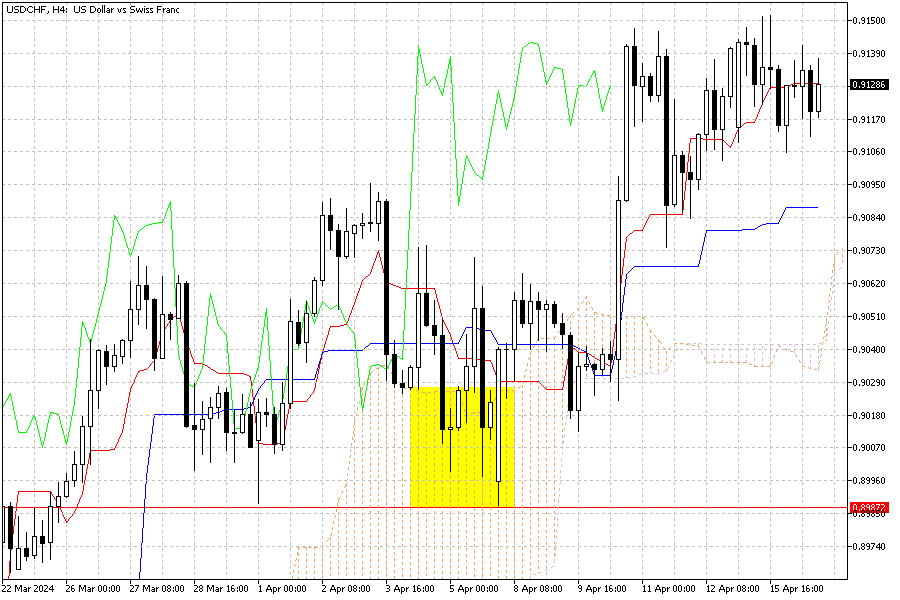
Please consider the USDCHF 4-hour chart below as an example of the bullish trend. As depicted, the price of the U.S. Dollar hovers above the cloud, which signals a bullish trend. As a result of this signal, the USDCHF price is on the rise.

- If prices are below the cloud, we’re in a bearish (downward) trend.
Earlier in this article, we provided an example of a EURUSD chart in which the price hovers below the cloud, which we interpret as a bear market.
- If prices are inside the cloud, it could mean that the market trend is neutral or about to reverse.
This part requires more attention, and traders must meticulously follow the market by eyeballing the price inside the cloud. When the price is inside the cloud, there is a high possibility that the trend might reverse or bounce from that price point and continue in the direction of the previous trend.

In the USDCHF chart above, I have highlighted the price point inside the cloud. In this chart, the U.S. Dollar dipped against the Swiss Frank and tested the 0.898 resistance. As a result, the 4-hour chart formed a Doji candlestick pattern inside the Ichimoku cloud, and consequently, the price of the trading instrument pulled back, and the bull market resumed.
Please note that the bull market would have been invalidated if the Swiss Frank could stabilize itself below the cloud against the U.S. dollar. Our analysts at FxNews use the Ichimoku Cloud in almost every article about market forecasts. We invite you to visit our technical analysis category to understand this indicator better in live examples.
Finding Support and Resistance Levels
The edges of the cloud can help you find potential support and resistance levels. In a bullish trend, Senkou Span A is the first support level, while Senkou Span B is the second. In a bearish trend, their roles are reversed.
Spotting Trading Signals
The Ichimoku Cloud can also give you trading signals:
- Bullish Signal: When the Tenkan-sen line crosses above the Kijun-sen line, it’s a sign to buy.
- Bearish Signal: When the Tenkan-sen line crosses below the Kijun-sen line, it’s a sign to sell.

- Strong Bullish Signal: If this cross happens above the cloud, it’s a strong sign to buy.
- Strong Bearish Signal: If this cross happens below the cloud, it’s a strong sign to sell.

Remember to align these signals with overall market trends for better trading decisions. We recommend reading this insightful article, in which we’ve utilized the Ichimoku Cloud for a comprehensive market analysis. It’s an excellent resource for familiarizing yourself with how to Trade Using the Ichimoku Cloud.
Wrapping Up
Trading with Ichimoku Cloud might initially seem complicated, but with practice, you’ll find it’s a great tool for making informed trading decisions. Remember to use other technical analysis tools and risk management techniques to improve your trading performance.