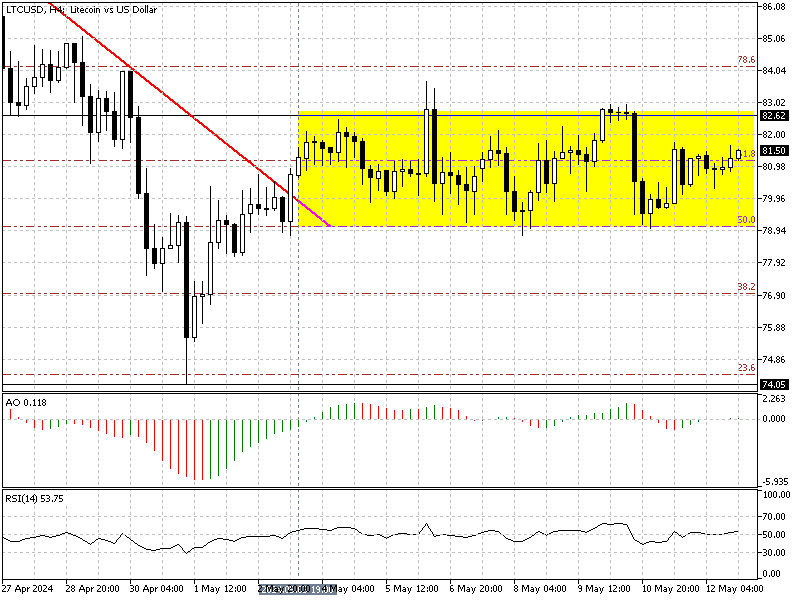
Our previous Litecoin technical analysis stated that Litecoin is in a bear market. However, investors witnessed bullish momentum after the price breached the descending trendline (in red). This breakout could reverse the trend from a bear market to a bull market if the buyers could stabilize the price above the $82.6 resistance.
Litecoin Slips into Consolidation Phase

In today’s trading session, the LTCUSD traded below the 82.6 resistance at about 81.3. This indicates that the bulls have failed to push the price above the $82.6 mark. As a result, the crypto asset’s price has stepped into a consolidation phase since May 3, and it has been ranging in a narrow area between $79 and the $82.6 mark ever since.
The ranging zone is highlighted in the 4-hour chart above.
Litecoin Eyes $82.6 – Technical Analysis

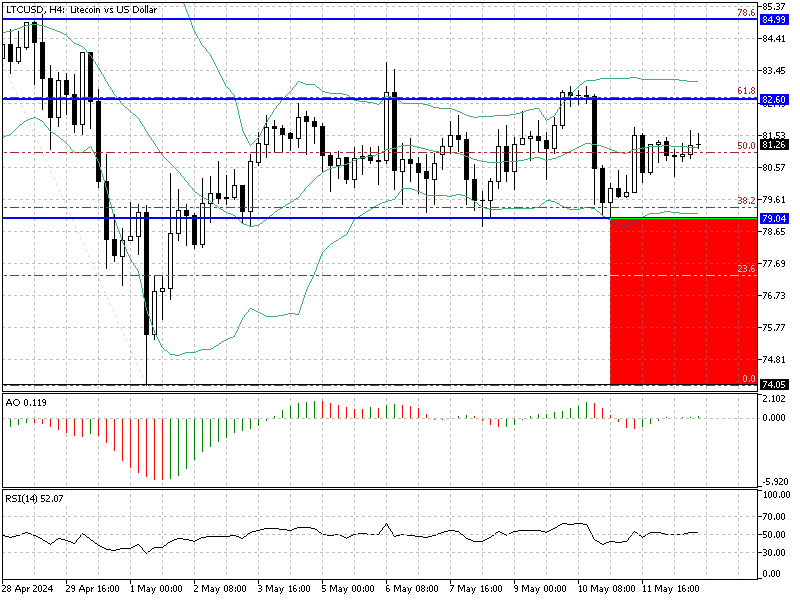
From a technical standpoint, Litecoin is in a sideways market, ranging above the $79.0 key support and the 50% Fibonacci retracement level. The relative strength index indicator value is 52, signaling that the uptick in momentum might continue. Therefore, the price will likely retest the $82.6 key resistance this week, and If the bulls cross and stabilize the price above it, the path to $84.0 will be paved.
Therefore, traders and investors should closely monitor the $82.6 barrier and look for candlestick patterns. If the chart forms a doji, Longwick bearish candlestick, or bearish engulfing pattern, the price will likely reverse downward, as it did three times in May.
The Bearish Scenario

On the flip side, $79.0 is the key support level. If the bears breach this level, selling pressure will likely increase, and the price might experience more losses, with the $74.0 mark as the next target.