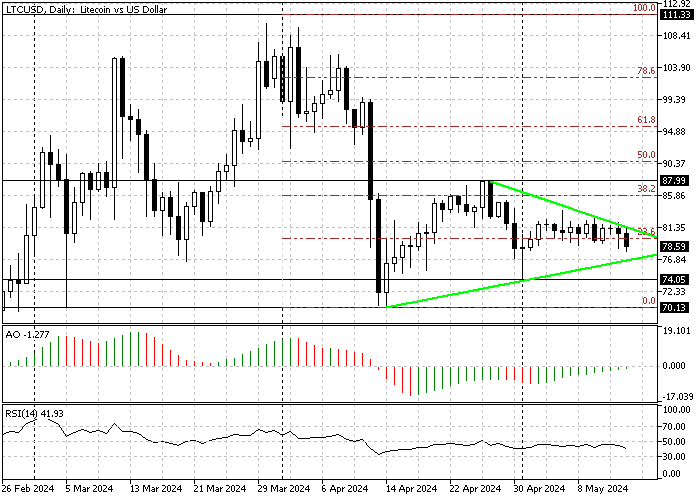
FxNews—Litecoin trades in a downtrend against the U.S. dollar and in a wedge pattern, as exhibited in the daily chart below.

Litecoin Technical Analysis – Downtrend Persists
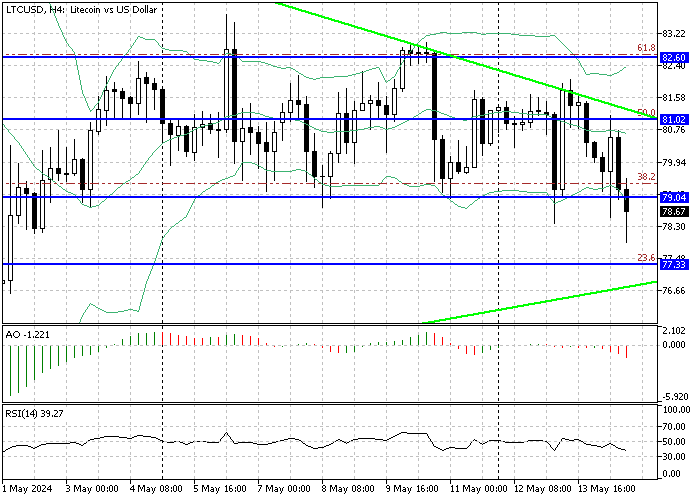
Zooming into the 4-hour chart, the LTCUSD pair has traded sideways between $79.0 and $82.6 for two weeks. In our previous technical analysis, we explored Litecoin’s sideways movements. We recommend checking that article; it helps you understand how prices shift from one level to another.

This week, the price failed to surpass the $82.6 barrier, and as a result, the value of Litecoin dipped below the $79.0 supply zone. This significant development could result in the price continuing the downtrend, which began on March 26 at $87.9.
The technical indicators support the bearish trend with the Awesome oscillator bars in red, hovering below the signal line, and the relative strength index floating around 38.5, below the median line. These developments in the technical analysis suggest the downtrend will likely continue.
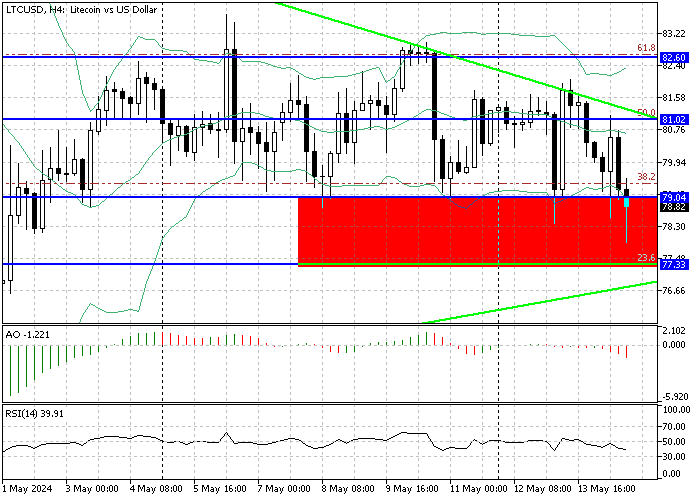
Litecoin Forecast – Bears Set Sights on $77.3

From a technical standpoint, the bears made a breakthrough from the $79.0 support. Therefore, the selling pressure should increase, and consequently, the downward momentum will likely escalate. In this scenario, the initial target can be the $77.3 mark, a supply zone backed by the wedge pattern. Should this level breach the path to $74.0, May’s all-time low will be paved.
The Bullish Scenario
On the flip side, the 50% Fibonacci stands between the bear and bull markets. The Bearish forecast above should be invalidated if the Litecoin price surges above the 50% Fibonacci, which neighbors the upper line of the wedge pattern.
In this case, the $79.0 breakout should be marked as fake, and the LTCUSD path to test the $85.0 will be cleared. It is worth noting that the $85.0 mark is in conjunction with the %78.2 Fibonacci retracement level.
Litecoin Key Support and Resistance Levels
- Resistance: $79.0, $81.0
- Support: $77,3, $74.0