...

Litecoin Technical Analysis – LTC Key Levels

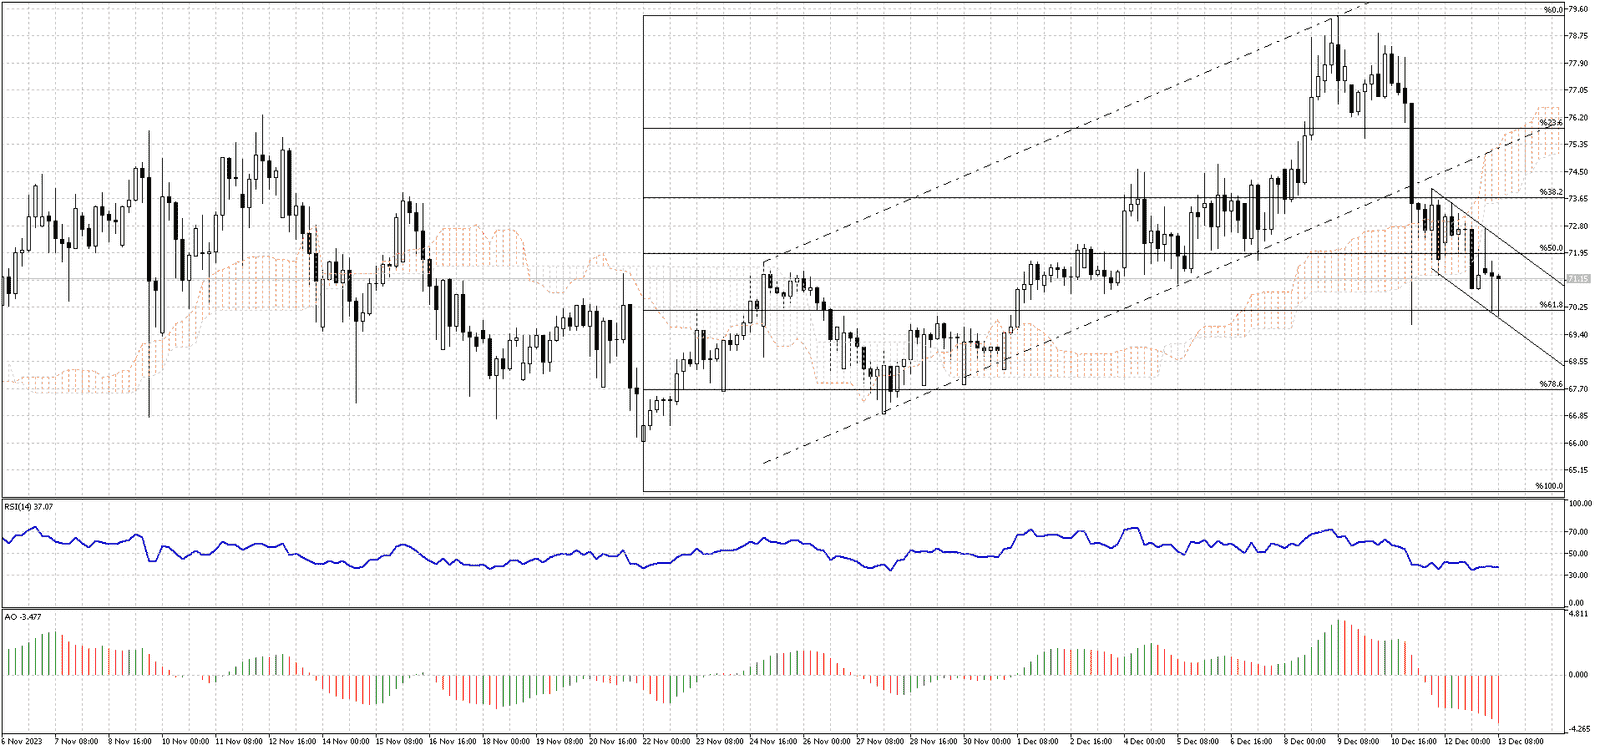
The LTCUSD pair experienced a downturn, moving away from the higher boundary of its previously bullish flag. This shift indicates increased selling pressure, which has led the price to touch the critical 61.8% Fibonacci support level.

Litecoin Technical Analysis – LTC Key Levels
Litecoin Technical Analysis - LTC Key Levels
Litecoin Technical Analysis – LTC Key Levels – 4H Chart

The Litecoin price is currently demonstrating a phase of consolidation just above this key support. In the current market, the price of Litecoin is fluctuating within a narrow bearish flag formation. This is noteworthy as the technical indicators are predominantly suggesting a selling trend.

However, there remains a potential for the Litecoin price to move upward and retest the Ichimoku Cloud. This scenario hinges on the bulls’ ability to sustain the price above the crucial 61.8% Fibonacci support level.

Conversely, if the price falls below the $70.25 threshold, the Litecoin value could further decline. In such a case, the next significant bearish target is anticipated to be the 78.65 support level.

Latest Posts

Gold Dipped Below $2667 Awaiting Direction

Gold traded sideways after it dipped below $2,667 and...

Gas Prices Dip Under $1.99 Amid Bearish Signs

Gasoline prices dropped below $1.99, which is active resistance....

Natural Gas Rebound Targets $3.24 and Beyond

U.S. natural gas bounced from $3.1, hinted by Stochastic's...

Crude Oil Head and Shoulders Signals Downward Trend

Crude oil formed a head and shoulders pattern in...

Inverted Hammer Hints at USDJPY Consolidation Ahead

USD/JPY trades bullish amid overbought signals. The 4-hour chart...

Gold Dipped Below $2667 Awaiting Direction

Gold traded sideways after it dipped below $2,667 and...

Gas Prices Dip Under $1.99 Amid Bearish Signs

Gasoline prices dropped below $1.99, which is active resistance....

Natural Gas Rebound Targets $3.24 and Beyond

U.S. natural gas bounced from $3.1, hinted by Stochastic's...

Crude Oil Head and Shoulders Signals Downward Trend

Crude oil formed a head and shoulders pattern in...

WTI Falls Below $71.5 on New Sanctions Against Russia

WTI Crude Oil prices fell slightly below $71.5 a...

Watch for Potential Drop in Gasoline Prices Below $2

FxNews—Gasoline is bullish. However, a dip below $1.99 could...

NATGAS Tests Critical Resistance: Bears Target $3.21

FxNews—The U.S. Natural Gas trades bullish above the %50.0...

Bullish Crude Oil Signals Overbought at $70.5

FxNews—Crude Oil trades bullish, above the 75-period simple moving...