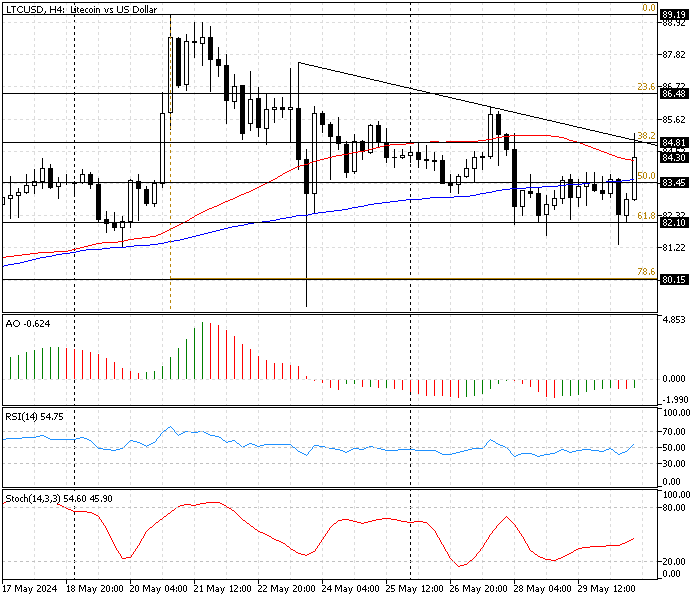
FxNews—Litecoin trades in a bearish trend against the U.S. Dollar, and as of writing, the LTC/USD pair exchanges at about $85.0. The Litecoin price is experiencing a sharp uptick in momentum from the 61.8% Fibonacci support at $82.1. Currently, the bulls are testing the descending trendline at $84.8, a demand area backed by the 38.2% Fibonacci retracement level.

Litecoin Technical Analysis – Daily Chart
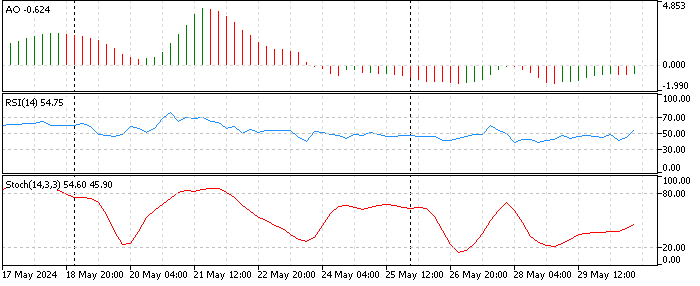
The technical indicators in the LTC/USD 4-hour chart give the following signals:
- The awesome oscillator leans toward the zero line with a value of -0.062, and its latest bar changed color to green. This indicates the market is gaining bullish momentum and might change direction soon.
- The RSI (14) value hovers above the median line at about 54, representing a neutral market with a mild bullish momentum.
- The stochastic oscillator value is 54.0, with the %K line floating in the middle, signifying a neutral market with a mild uptrend momentum.

These developments in the technical indicators in the 4-hour chart suggest the market suffers from uncertainty about the trend direction, but investors have a mildly bullish outlook for the future price of Litecoin.
Litecoin Price Forecast – May-30-2024

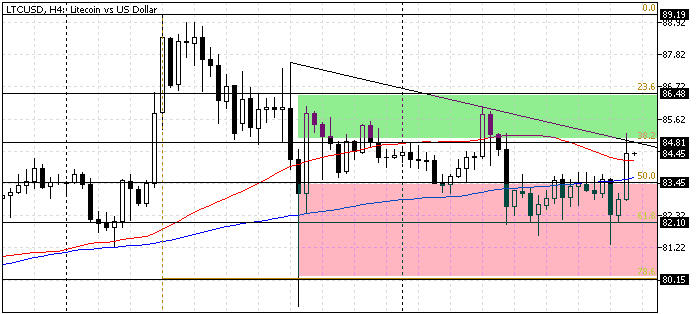
From a technical standpoint, the primary trend is bearish because the LTC/USD pair is below the descending trendline at $84.8. The downtrend will likely restart if the bears hold below the immediate support at $84.8, in conjunction with the %38.2 Fibonacci. If this scenario unfolds, the first bearish target should be the 50% Fibonacci at $83.4. If selling pressure exceeds this level, the Litecoin price could decline to 61.8% Fibonacci at $82.1.
The bearish outlook should be invalidated if the LTC/USD price overreaches the immediate resistance at $84.8.
The Bullish Scenario
As explained earlier, the immediate resistance is at $84.8. This resistance level is robust because it has the descending trendline as a backup. If Litecoin rises above SMA 50 and the 38.2% Fibonacci level ($84.1), today’s bullish momentum from $82.1 will likely target the 23.6% Fibonacci level at $86.4.
If this scenario comes into play, $84.8 will support the bullish trend.
Litecoin Key Support and Resistance Level
Traders and investors should closely monitor the LTC/USD key levels below to make informed decisions and adjust their strategies accordingly as market conditions shift.
- Support: $83.4 / $82.1 / $80.1
- Resistance: $84.8 / $86.4
Disclaimer: This technical analysis is for informational purposes only. Past performance is not necessarily indicative of future results. Foreign exchange trading carries significant risks and may not be suitable for all investors. Always conduct your research before making any investment decisions.